
I. Sentiment Indicators
Today, I am going to take a shorter term view 2016-17 to allow more detail in the charts, but year-end 2015 is still my analog. The overall Indicator Scoreboard shows a slight uptick in bearishness, mostly from Thurs decline.

The Short Term Indicator (VXX $ volume and Smart Beta P/C) continues its sideways dance with a slight decline in the Smart Beta P/C offset by a slight increase in the VXX $ volume.

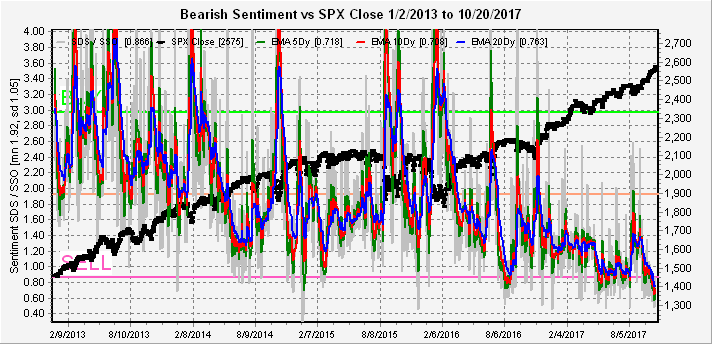
Taking a longer term look at the money flow ETFs SDS/SSO and QID/QLD, the short/long ratios are at extreme lows and are approaching the reverse of the 2013 levels. So when the top appears, it will probably be more significant than most expect.

Taking a look at bonds (TNX), since the Sept SELL, rates have moved backup to the mid-year highs at 2.4%, but with lower bearish sentiment. Will this lead to a breakout that tests the 1 yr highs at 2.6% or even go higher? My contention is that the Republican goal to borrow as much as possible while rates are low (the Trump path to prosperity) will eventually backfire with higher rates pulling asset prices down.

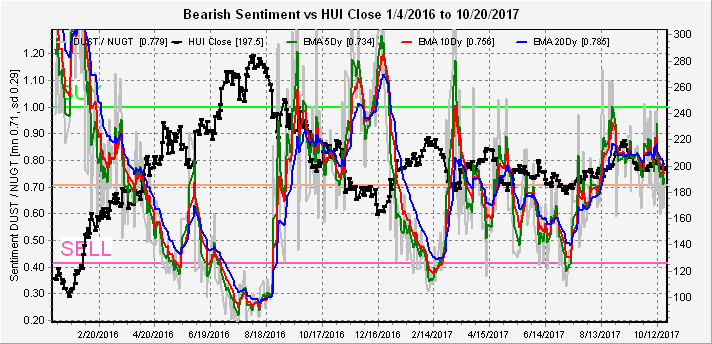
The gold miners (HUI), may be an early indicator of the outcome of the pro-growth tax cuts, as prices fell modestly even as bearish sentiment declined. Will gold miners be the first victim of higher rates?
II. Options Open Interest
The effectiveness of options OI as certainly been reduced as the relentless upward pressure has overwhelmed all resistance from SPY calls, so interpret the following with a grain of salt. Currently with the SPY at 257, we are in delta hedging, so the Wed "most likely" at 255 probably means little, while continued upward pressure could go to 259.

The story for Fri is pretty much the same although stronger resistance shows up at SPY 260.

Taking a quick look at next month's exp for Nov, the "most likely" is a decline down to SPY 254 with strong resistance at 259, but the outcome probably depends more on the overall sentiment picture.

Conclusions. The SPX broke out of the expected 2560-70 range and I am beginning to wonder what it will take for the bears to give up. Oct always seems to be a favorite of the bears with talk of "crashes" and "cycles", so hopefully Nov will see the bears go into hibernation so a pullback can begin. Until we see a sharp decline in the ST Indicator no shorting is advised, and I have no further upside targets.
Weekly Trade Alert. Nothing this week. Updates @mrktsignals.
Investment Diary, update 2017.10.xx, (in progress) Indicator Primer
Article Index 2017 by Topic
Article Index 2016 by Topic
© 2017 SentimentSignals.blogspot.com
No comments:
Post a Comment