
I.A. Sentiment Indicators - Normal
This week I want to take a closer look at some of the indicators short term so they will be in Part B. The overall Indicator Scoreboard bounced back to neutral on the Wed decline.
The Short Term Indicator (VXX $ volume and Smart Beta P/C) had a stronger move up on the back of the sharp jump in the VXX $ volume.

For bonds (TNX), the week started with a breakout over 2.4%, but the late news of Howell's preference as the new Fed Head caused a pause at weeks end. Its seems like Trump floats a different idea every day then waits to see the markets reaction. Longer term, higer growth will push rates higher.

For gold miners (HUI), prices have paused near recent lows, but bearish sentiment continues to fall as bulls continue to expect growth and inflation to be a good thing. Don't they remember that in 2000 growth and inflation were twice today's levels, but gold was only $300/oz? In addition, here is a five year Stockcharts example of the close relationship between gold (black) and interest rates (red, 1/TNX), especially in 2017.

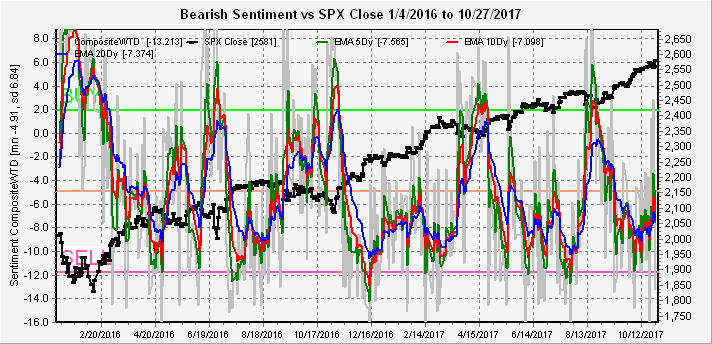
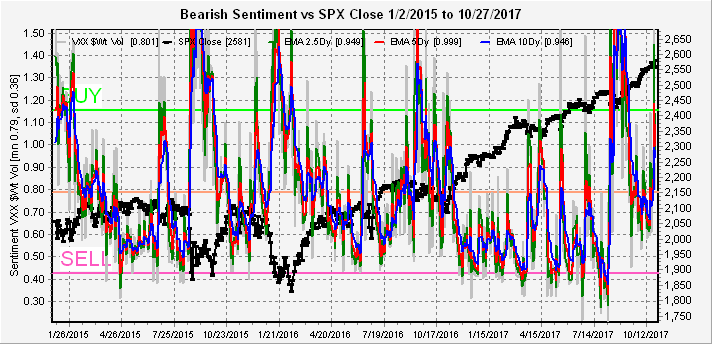
I.B. Sentiment Indicators - Short Term EMAs 2015-17
I noticed several contrasting indications looking thru the data, so I want to highlight them here. First, looking at the ST indicator components, the Smart Beta P/C has finally started to decline, reaching the initial SELL level at -0.40 reached Oct 23, 2015. But the final top saw a lower level at -0.45.

The VXX $ volume had a huge jump on Wed, generating a ST BUY, and comparing this to late 2015, it never reached the SELL level and even showed a BUY spike early Dec.
There is also a conflict with the shorter term 3x ETFs, where the SPXU/UPRO has reached much lower levels than in late 2015.

While the 3x NDX SQQQ/TQQQ ETFs had declined to a below neutral sentiment level, but last Wed saw a BUY spike.

II. Options Open Interest
Last week short pullback may be an indication of options OI influence returning as Wed close at SPY 255.3 was just over the forecast 255. For Wed, strong resistance at 258 may cause a slight pullback to 257 or lower from 257.7.

For Fri, the upside for SPY looks more promising with a "most likely" at 257, but little resistance until 260, perhaps good job numbers will encourage the bulls.

Nov expiration is starting to look less favorable for the bulls with a "most likely" at SPY 255, and the large call positions at 255 and 260 are like to cause some fairly wild swings due to delta hedging.

As posted on Twitter last week, more bad news for the gold miners as decline below GDX $23 leaves almost no put support. Prices may bounce back, but any rise in interest rates will have dangerous implications.

Conclusions. The standing dominoes are down to one as the Smart Beta PC has joined the other indicators showing very low bearishness. The high VXX $ volume continues to be a problem as does the spike in bearishness for the NDX short term. SPY open int shows that a small pullback may be followed by a sharp rally toward 260 by end of the week, but by options exp week (Nov 17) a more sizable pullback may begin.
Weekly Trade Alert. For those that like to gamble a small pullback on the SPX may be a BTFD with a target of roughly 2600, but I will be watching more closely at indications of a shorting opportunity. Updates @mrktsignals.
Investment Diary, update 2017.10.28, Indicator Primer
Article Index 2017 by Topic
Article Index 2016 by Topic
© 2017 SentimentSignals.blogspot.com
No comments:
Post a Comment