
Friday's pullback was no surprise since the SPX options open int has shown for two weeks the potential for a pullback to 2800 due to weak put support and it was a sign of strength that the low was 2826. There is a good chance that the next two to three days will see some volatility between SPX 2820-50 similar to what we saw between 2800-30 a couple of weeks ago before a 70 pt rally. There is a good chance that Wall St will want to make a new high around Aug 22 since that would make this stock market the longest bull market in history.
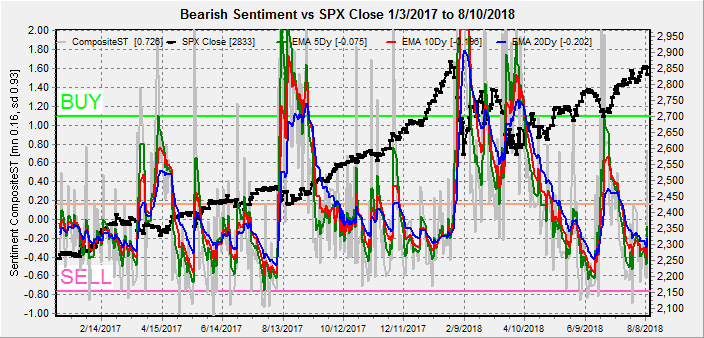
I. Sentiment Indicators
The overall Indicator Scoreboard (INT term, outlook two to four months) moved higher back to neutral, but a few more days of volatility are likely for the longer EMAs to reach the level of two weeks ago before the bounce from SPX 2800.

The INT view of the Short Term Indicator (VXX $ volume and Smart Beta P/C, outlook two to four months) saw a small upward blip Fri. but continues to follow the overall pattern seen in Dec 2017 - Jan 2018.
Bond sentiment (TNX) pulled back up to the mean last week, especially on Fri, as domestic traders were net sellers while demand from overseas with additional Trump sanctions on Turkey pushed the dollar higher and bond rates lower.

For the INT outlook with LT still negative, the gold miners (HUI) bearish sentiment leveled out last week even as prices moved lower. The stubborn bullishness of the gold bugs is probably due to turmoil from the trade/sanctions of Trump, but "don't fight the Fed" is probably more important in a tightening cycle.

II. Dumb Money/Smart Money Indicators
The Risk Aversion/Risk Preference Indicator (SPX 2x ETF sentiment/NDX ETF sentiment, outlook 2 to 4 days/hours) as a very ST indicator remains near the bottom of its TL. As I've pointed out that this would likely lead to underperformance of the NDX to SPX, the last cycle saw a lower higher for the NDX even as the SPX made a new recovery high and does not bode well for the longer term.

The option-based Dumb Money/Smart Money Indicator as short/INT term (outlook 2 to 4 days/weeks) again is approaching the BUY level with the Fri decline, but since the last bottom was neutral 2-3 days more of volatility are likely to trigger a BUY. A SPX 2850 to 2820 whipsaw range is likely.

The INT term SPX Long Term/Short Term ETFs (outlook two to four weeks) bearish sentiment has been hovering near neutral for several weeks now and a sustained move either way is unlikely.

Long term neutral, the INT term NDX Long Term/Short Term ETF Indicator (outlook two to four weeks) has also been in a tight range for several weeks.

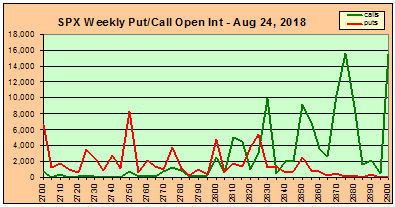
III. Options Open Interest
Using Thurs close, remember that further out time frames are more likely to change over time, plus last Fri high P/C ratios implies stronger put support than currently shown. This week I will look out thru Aug 24.
Mon shows that over SPX 2830 put support is likely to push prices up to 2845 with call resistance starting at 2850. Open int is relatively light.

Wed shows somewhat stronger put support with pretty much the same price range as Mon. This does not rule out an up Mon/down Tue/ back up Wed sequence.

Fri AM for monthly exp could mean a drop to SPX 2800 with strong resistance at 2825. A drop is more likely with an immediate rally to SPX 2850 early in the week that holds thru Wed.

Fri PM, shows huge call positions at SPX 2875-900, while modest put open int show support up to 2845.

For Fri Aug 24, open int is much like last Fri where a strong market could push into the SPX 2830-50 area, but a weak market could drop to 2800-10.
IV. Technical/Other
Just wanted to take a look at a couple of charts for SPX and NDX that currently show possible ending diagonals.
The SPX looks like a move up to 2875 could set up a drop to the 200 SMA at 2700.

While the NDX looks a little more ominous on a longer time frame.

Conclusions. The next two weeks could be a repeat of the last two weeks where several days of volatility created enough bearishness for a bounce up to SPX 2864 from 2794. Overall bearish sentiment is starting to fade, and the next high could be followed by a larger decline down to SPX 2700. The consensus of a drop to SPX 2790 is likely again to be surprised. Aug 22 is the date that the current bull market from the Mar 2009 lows will exceed the 1991-2000 bull market as the longest in history and was followed by ten years of volatility like the 1970s. What can we expect for the 2020s?
Weekly Trade Alert. A retest of the previous two weeks could see a few days of whipsaw between SPX 2820-50 with increasing bearish sentiment before a move to ATHs. A stronger move that holds near 2850, however, could see a late week fade like last week toward 2800. Updates @mrktsignals.
Investment Diary, Indicator Primer, update 2018.03.28 Dumb Money/Smart Money Indicators
Article Index 2018 by Topic
Article Index 2017 by Topic
Article Index 2016 by Topic
Long term forecasts
© 2018 SentimentSignals.blogspot.com
No comments:
Post a Comment