
Stocks continued to slump last week with several indicators, including the ST Indicator and 2x ETF indicators only showing neutral readings, meaning that the decline has much further to go. In contrast, the options based indicators are at bearish extremes, indicating that a sharp short-term counter rally is likely into the June optns exp.
I. Sentiment Indicators
The overall Indicator Scoreboard (INT term, outlook two to four months) bearish sentiment has risen to levels about equal to Aug 2017, but nowhere near the Feb or Oct 2018 declines. No sustainable bottom yet.

The INT view of the Short Term Indicator (VXX+VXXB $ volume and Smart Beta P/C, outlook two to four months) bearish sentiment has reached no higher than that of July 2018's SPX 100 pt decline, while the SPX is now down 200 pts. Any bounce here is temporary.

Bonds (TNX). Interest rates are showing almost panic buying as the public is fleeing stocks.

For the INT outlook with LT still negative, the gold miners (HUI) finally caught a bid and may be heading to the 160 area to setup the larger H&S pattern while bearish sentiment is falling sharply.

II. Dumb Money/Smart Money Indicators
For this week and possibly for the next several months, I am going to replace the DM/SM ETF indicators with other indicators.
The option-based Dumb Money/Smart Money Indicator as short/INT term (outlook 2 to 4 mns/weeks) continues to move up sharply, now near the Aug 2017 and Feb 2018 SPX lows, but lagging the Oct 2018 lows.

And the sister options Hedge Ratio sentiment is showing similar levels, indicating that a pause in the decline is likely near current levels.

The INT term SPX Long Term (2x/DM) ETFs (outlook two to four weeks) bearish sentiment has moved back back to neutral after a brief spike on the initial downturn. Any pause or relief rally is likely to be followed by strong selling.

The INT term NDX Long Term (2x/DM) ETFs (outlook two to four weeks) bearish sentiment also saw a strong initial spike, but has since retreated.

III. Options Open Interest
Using Wed close, remember that further out time frames are more likely to change over time, and that closing prices are more likely to be effected. This week I will look out thru Jun 7, the job report comes out Fri . Also, This week includes a look at the GDX for Jun 21.
With Fri close at SPX 2752, there is no strong put support until 2725, but strength in prices may push prices to 2775.
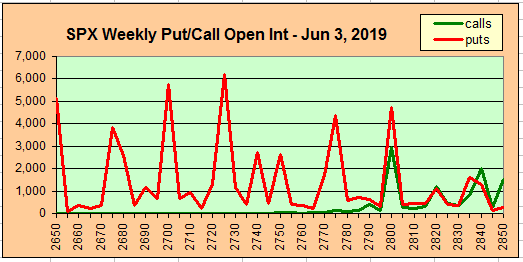
Wed shows strong put support moving down to SPX 2700, while moderate support may keep prices above 2750.

For Fri, shows very strong put support for the SPX at 2750 and below, while a positive jobs number may pull prices up to 2800 or higher..

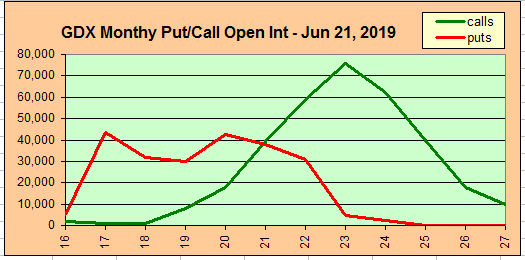
Using the GDX as a gold miner proxy. Now at 21.56, for Jun exp there is strong call resistance at 22-3 and may push prices back to put support at 21.
The TLT 20 year bond fund is used as a proxy for interest rates. For the last several years when the TNX was 112 when the TNX was 3.2% (11/2018), the TLT was 124 when the TNX was 2.5% (12/2017), and the TLT was 140 when the TNX was 1.5% (08/2016).
Currently the TLT is 131.8 with the TNX at 2.14%. For Jun 21, there is strong put support at 129 and call resistance at 131 that should push prices down toward 130.
IV. Technical / Other - N/A
Conclusions. Sentiment, especially options, are showing the potential for a sharp rally, possibly to 2850, for Jun options exp, possibly due to signs of dovishness from the Fed with the FOMC Jun 18-19. Other sentiment. especially ETFs, are showing that the decline has only begun. I would not be surprised to see a double-top H&S combination with some easing by the Fed by the fall (SPX possible 2500-600) to prevent a re-occurrence of Q4 2018, giving a RS equivalence to the Jan 2018 top. See last week's Tech/Other.
Weekly Trade Alert. Signs of strength should emerge by the EOW and continue into optns exp retracing about 50% of the decline from the early May top. Updates @mrktsignals.
Investment Diary, Indicator Primer, update 2019.04.27 Stock Buybacks, update 2018.03.28 Dumb Money/Smart Money Indicators
Article Index 2019 by Topic
Article Index 2018 by Topic
Article Index 2017 by Topic
Article Index 2016 by Topic
Long term forecasts
© 2019 SentimentSignals.blogspot.com
Arthur, your posts are excellent and I look forward to reading them each Sunday....keep it up! Please explain your comment "I would not be surprised to see a double-top H&S combination with some easing by the Fed by the fall (SPX possible 2500-600)". Do you mean the S&P may fall to 2500 - 2600 and the Fed may do some easing in the FALL (Sep - Oct)?
ReplyDelete