
Sentiment continues to deteriorate, but with most of the weak hands already withdrawn from the market, it may take a stronger than normal negative surprise to shake up the strong hands remaining. As Jamie Dimon said regarding sub-prime mortgages in 2008, "As long as the music is playing, you have to keep dancing". Some short term sentiment cautioning the bears is covered in Tech/Other. Overall, at least a ST top is likely in the next 2 to 6 weeks, but sentiment does not currently show an INT top likely. To get a better view of the INT sentiment, this week I am using 2x EMAs for the WTD and ST composites as well as the SPX LT/ST ETF indicator.
I. Sentiment Indicators
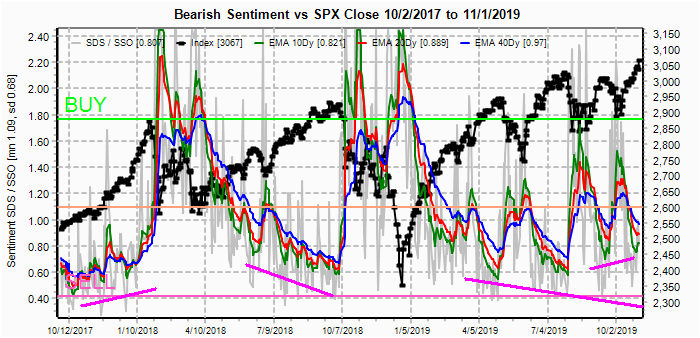
The overall Indicator Scoreboard (INT term, outlook two to four months using 2x EMAs) bearish sentiment from an INT perspective still has a way to go before reaching levels seen in Jan or Oct 2018, or even April 2019, but is consistent with the Sept top before an SPX 100 pt drop.

The INT view of the Short Term Indicator (VXX $ volume and Smart Beta P/C [ETF Puts/Equity Calls], outlook two to four months using 2x EMAs) bearish sentiment showed a declining trend before the INT tops in Jan and Oct 2018 and currently seems to be weeks, if not months, away from reaching that level.

Bonds (TNX). Interest rates have been consolidating in a triangle pattern since July and is nearing the apex where a significant breakout is likely. The following chart of the banking index (BKX) ETFs shows a breakout just occurred over 102.5, and since banks borrow ST and lend INT this likely means that bank stocks are expecting the yield curve to un-invert with rising INT rates.


For the INT outlook with LT still negative, the gold miners (HUI) bearish sentiment remains very low while HUI prices remain over 200, but the direction of TNX rates will likely push prices in the opposite direction.

II. Dumb Money/Smart Money Indicators
The option-based Dumb Money/Smart Money Indicator as short/INT term (outlook 2 to 4 mns/weeks) show a drop in bearish sentiment similar to July 2018 as the SPX held over 3000, but does not show a danger level.

And the sister options Hedge Ratio sentiment briefly reached the SELL level ST early last week, but the early week volatility reversed sentiment as hedging remained strong thru the weeks end and is similar to July 2018.

The INT term SPX Long Term (2x/DM) ETFs (outlook two to four weeks using 2x EMAs) bearish sentiment should be showing a pattern of declining bottoms INT but appears to be rising ST. Does this mean we will have a blow off top as Jan 2018 or a longer topping period to allow sentiment to drop? Only time will tell.
The INT term NDX Long Term (2x/DM) ETFs (outlook two to four weeks) bearish sentiment remains at very low levels but is about midway between the Jan and Jun-Oct 2018 levels..

III. Options Open Interest
Using Wed close, remember that further out time frames are more likely to change over time, and that closing prices are more likely to be effected. This week I will look out thru Nov 8. Also, This week includes a look at the GDX for Nov.
With Fri close at SPX 3067, about all you can say for Mon is that there is huge call resistance at SPX 3100. As long as SPX is over 3050 delta hedging can push prices higher.

Wed has small OI, but SPX 3050 and 3065 are the critical levels as there is little support until 3020.

For Fri larger OI shows 3050 and 3100 levels as critical, as a break below 3050 could push down to 3000-20, while the area between 3050 and 3100 is likely to see a lot of volatility if it holds..

Using the GDX as a gold miner proxy. For Nov 15 exp with the current price at $28, GDX faces stiff call resistance at $28.5 and if int rates breakout to the upside is likely to drop to put support near $26.

IV. Technical / Other
This week I will look at the NYMO, NYAD and NYUD that show similarities to the period before prior INT tops. Starting with the NYMO, the recent pattern resembles that leading into both the Apr and July tops and probably should be monitored over the next 2-6 weeks to see if the trend continues.

The NYAD is also showing similarities to the same period. Where both NYAD and NYMO show fractals 4-6 weeks before the SPX tops.

The NYUD is also simal to the same periods as well as Dec 2017 before the Jan melt up in 2018, as investors seem to go all in the last few weeks of a rally.

Looking at some of the composites, the ratio of A/D issues to volume shows fading support of advancing issues that preceded ST tops, but not at the level seen before INT declines

Finally, the ratio of volume declining to issues declining as a capitulation indicator, where high levels typically precede a rally and very low levels precede a top. Here this is more indicative of a ST rally, followed by an INT decline.

Conclusions. Last week, I was looking for a top into Wed followed by a 1-2% decline on an FOMC "sell the news", which is exactly what happened with a 1% decline. The rally Fri to SPX 3067 has meet my upside target of 3060-70 and I have no further price targets ST. Sentiment (SPX ETFS and NYUD) does show the possibility for a continued melt up to 3100-50, while most indicators show higher prices may persist for 2-6 weeks before at least a ST top.
We also have setup similar to Nov-Dec 2015, where a price peak was reached the first week of Nov, a small pullback and a retest in mid Dec, then of course the larger decline in Jan. This is consistent with the House making minimal impeachment progress before the six week break starting mid Nov, then coming on strong in Jan.
Weekly Trade Alert. Too difficult to call, but I am leaning toward the Nov-Dec 2015 fractal with a smaller decline over the next couple of weeks to aboui 3000 then an ATH retest mid Dec. Jan-Feb may see a test of the SPX 200 SMA that would be around 2950. Updates @mrktsignals.
Investment Diary, Indicator Primer, update 2019.04.27 Stock Buybacks, update 2018.03.28 Dumb Money/Smart Money Indicators
Article Index 2019 by Topic
Article Index 2018 by Topic
Article Index 2017 by Topic
Article Index 2016 by Topic
Long term forecasts
© 2019 SentimentSignals.blogspot.com
No comments:
Post a Comment