
Essentially all price objectives since the mid-Oct lows have been met. The SPX exceeded the price target of 4650, reaching 4720 last week before a pullback below 4700. The DJIA also reached the 36k target and the DJTA exceeded its prior high on Tue with a 2000 pt jump on Tue (close +1000) with a huge move of +200% intraday in Avis (CAR). Even as the Fed committed to a QE taper program of 15 B/mn, int rates (TNX) fell as economic data, outside of the lagging jobs data, points to a slowing economy. A slowdown that negatively effects EPS may be the source of trouble in early 2022.
Timing, however, still seems to point to several weeks before serious problems emerge as the ST Indicator remains near neutral, while the major support for the market, the hedging activity as measured by the hedge spread, is recently showing much weaker support. The period around mid-Dec still remains the most likely time for an important top and may be a lower high as in Dec 2015. There is likely to be at least one test of the Sept highs at SPX 4550 (below 4600) in the interim.
I. Sentiment Indicators
The INT/LT Composite indicator (outlook 3 to 6+ months) has three separate components. 1st is the SPX and ETF put-call indicators (30%), 2nd the SPX 2X ETF INT ratio (40%), and 3rd a volatility indicator (30%) which combines the options volatility ratio of the ST SPX (VIX) to the ST VIX (VVIX) with the VXX $ volume.
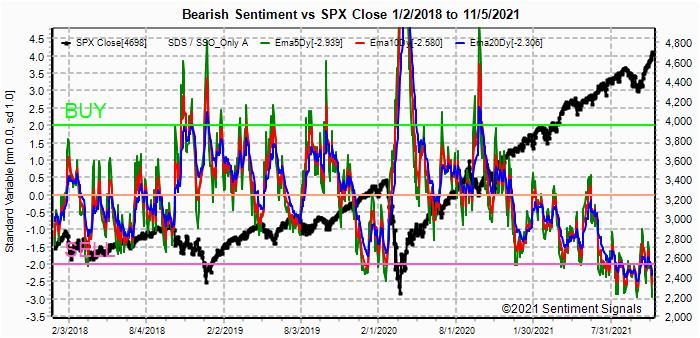
New lows were made last week for the INT/LT Composite.

Nothing happened after the early Oct Sell which could simply be early as in early May.

Continurd low levels of bearish sentiment are a warning of trouble ahead.

The sharp decline in the ST EMAs (grn) indicate that a pickup in volatility is likely.


The continued narrow range of sentiment likely means more of the narrow price range seen recently.

II. Dumb Money/Smart Money Indicators
This is a new hybrid option/ETF Dumb Money/Smart Money Indicator as a INT/LT term (outlook 2-6 mns) bearish sentiment indicator. The use of ETFs increases the duration (term).
Lows in bearish sentiment appears to be in several months before the final INT top as was seen Aug 2018 and Dec 2019.


III. Options Open Interest
Using Thur closing OI, remember that further out time frames are more likely to change over time, and that closing prices are more likely to be effected. Delta hedging may occur as reinforcement, negative when put support is broken or positive when call resistance is exceeded. This week I will look out thru Nov 12.
With Fri close at SPX 4370, options OI for Mon is very small, but shows extreme bullish sentiment with weakness possible toward the SPX 4650 level.


IV. Technical / Other
N/A
Conclusions. SPX prices have risen somewhat.farther and certainly faster than expected, but sentiment is indicating that an important top may be only a few weeks away. Currently, I am expecting that top mid to late Dec with no further upside targets.
Weekly Trade Alert. Next week looks like it will be the typical ST pullback before a run higher into optn exp Nov 19th. Lows will likely be limited to SPX 4625-50, while a larger pullback to test the breakout level of 4550 may occur late Nov-early Dec. Updates @mrktsignals.
Investment Diary, Indicator Primer,
update 2021.07.xx Data Mining Indicators - Update, Summer 2021 (in progress),
update 2020.02.07 Data Mining Indicators,
update 2019.04.27 Stock Buybacks,
update 2018.03.28 Dumb Money/Smart Money Indicators
Article Index 2019 by Topic, completed thru EOY 2020.02.04
Article Index 2018 by Topic
Article Index 2017 by Topic
Article Index 2016 by Topic
Long term forecasts
© 2021 SentimentSignals.blogspot.com
No comments:
Post a Comment