
Last week I mentioned that US/NATO sanctions against Russia could create more problems than expected, and Mon 15% opening spike in oil and increases in other commodity prices certainly supported that idea. Looking at the BIG picture, I think that we may be on the cusp of a decade(s) long global trade war between the producers (China for goods, and Russia and ME for commodities) and the consumers (US, Japan and EU). Since the 1980s, the consumers have controlled global finances with the US$ as a reserve currency and have accrued a disproportionate share of the wealth while keeping producers prices and profits low. Trump fired the first salvo at China in 2017, but he fired only blanks as tariffs announced were quickly rescinded or delayed as soon as the SPX dropped 2%+ and the trade deficits were larger at the end of his term than before. Sanctions against Russia are likely to be much more effective and have much more adverse effects on global trade and be longer lasting. The US started the last global trade war with the introduction of the Smoot-Hawley tariff act in May 1929 (passed Mar 1930), I guess you could say we won but only after a 10 year depression and a world war. Then we were the #1 goods and commodity producer, but now our main production is just US$.
No major changes in sentiment this week. Tech/Other takes a look at the performance of the SPX during mid-term election years since 1950 and a ST indicator that indicates a bounce is likely next week.
I Just wanted to briefly mention two other analysts views that point to a low soon in the SPX 4000-4100 area with an ED. The first is Trader Joe who uses SPX closes and the second is Simon M of iSPYETF. With the next Bradley turn date on Mar 28, a rally this week may be a "false flag" with a lower low the following week.
I. Sentiment Indicators
The INT/LT Composite indicator (outlook 3 to 6+ months) has three separate components. 1st is the SPX and ETF put-call indicators (30%), 2nd the SPX 2X ETF INT ratio (40%), and 3rd a volatility indicator (30%) which combines the options volatility ratio of the ST SPX (VIX) to the ST VIX (VVIX) with the VXX $ volume.
Update. INT/LT sentiment remains high but is not likely to cause a strong bounce until some resolution of the Ukraine/Russian invasion.

Update. Sentiment still positive.
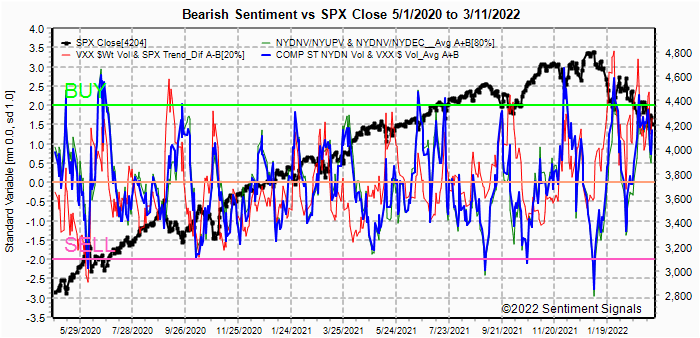
Update. The ST/INT Composite indicator remains near the Buy level.

Update ema. Also little change.


Update. The spike in oil and ag commodities has provided an unexpected bounce in the gold miners, but also a sharp drop in sentiment that could lead to a sharp drop in prices if conditions change in Ukraine.

II. Dumb Money/Smart Money Indicators
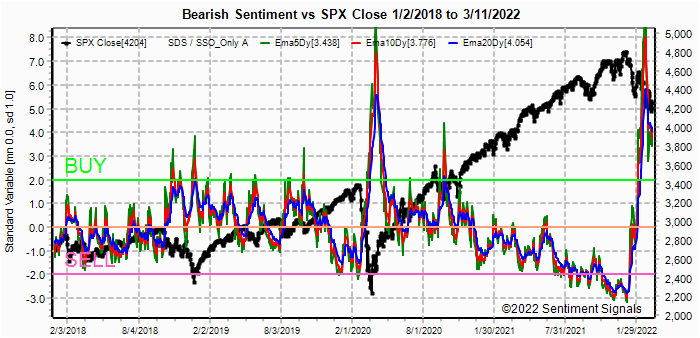
This is a new hybrid option/ETF Dumb Money/Smart Money Indicator as a INT/LT term (outlook 2-6 mns) bearish sentiment indicator. The use of ETFs increases the duration (term).
Update. Sentiment remains near high extremes.


III. Options Open Interest
Using Thur closing OI, remember that further out time frames are more likely to change over time, and that closing prices are more likely to be effected. Delta hedging may occur as reinforcement, negative when put support is broken or positive when call resistance is exceeded. This week I will look out thru Mar 18. A text overlay is used for extreme OI to improve readability, P/C is not changed.
With Fri close at SPX 4204, options OI for last Fri shows that OI alone was not able to hold up prices. The small net call OI at 4290 stopped the rally while the late selloff to 4200 easily went thru the 2k net put support at 4225 - a sign of ST weakness.

Options OI for Mon is small, but overall P/C is positive. Put support exists up to SPX 4250, but given Fri weakness, a drop below 4200 could drop to 4150 but is likely to bounce back to 4200+.


IV. Technical / Other
First,I want to repost something I saw on Twitter about mid-term election years since 1950. here He has incorrectly included 2022, but the results indicated an avg decline of 17% over the previous 18 periods with an average low in month 10 (Aug). The conclusion being that the decline may continue for a few more months before a final bottom (Fed pauses rate hikes), but the expected rally after is ~30%.
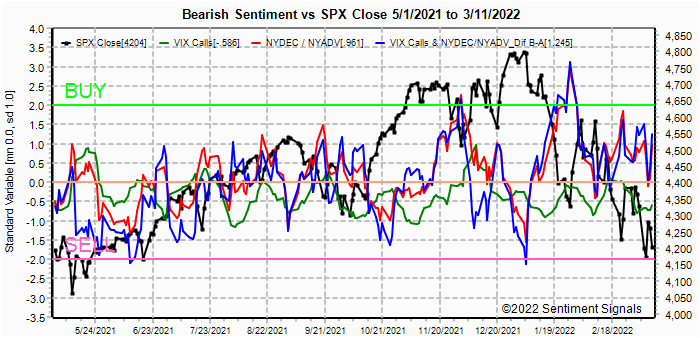
One ST indicator I have been watching is the VIX Calls and NYDec/Advs. It seems to work better when VIX is high (30+) and indicates a ST bounce is likely.
Conclusions. With the SPX 200 SMA at 4467 and 50 SMA at 4476 the SPX is very likely to see a "death cross" next week as the 50 goes below the 200, but how deadly is it? Since 2008, I found 4 times the DC occurred from a multi-year high with the Dec 2007 and 2018 disasters, while Aug 2011 and 2015 occurred near lows that were retested several months later. This one looks like it will be near a low, and a retest in several months seems to square better with the mid-term cycle.
Weekly Trade Alert. Traditionally, optn exp week has started off weak with a rally starting Tue/Wed and extending into Fri close. Given the uncertainty of world events, however, nothing has been traditional for over 2 years, but options OI is indicating this is what is likely with no outside surprises. That said Mon-Wed is showing firm put support at SPX 4150-200 and FOMC results may be a dud since results are already indicated by Powell. With Fri showing large put positions up to 4400, a rally may start late Wed to 4250-300 with continuation to 4400-50 on Fri. Updates @mrktsignals.
Investment Diary, Indicator Primer,
update 2021.07.xx Data Mining Indicators - Update, Summer 2021 (in progress),
update 2020.02.07 Data Mining Indicators,
update 2019.04.27 Stock Buybacks,
update 2018.03.28 Dumb Money/Smart Money Indicators
Article Index 2019 by Topic, completed thru EOY 2020.02.04
Article Index 2018 by Topic
Article Index 2017 by Topic
Article Index 2016 by Topic
Long term forecasts
© 2022 SentimentSignals.blogspot.com
No comments:
Post a Comment