
Last week I was looking for a rally to SPX 4100 before a washout decline to the low 4000s by the Bradley turn date on May 14, but instead news of economic weakness in China pushed prices down directly, bottoming late Thur at 3860 almost an exact 20% decline from the Jan 4820 top. This was stronger and longer than the Q1 decline of 15-18% forecast in Dec 2021, but is more supportive of what you would expect for an SC4. So I want to further outline my LT expectations based on what has happened so far. First there was an excellent article last week outlining the three phases of a bear market and why we were likely close to the end of the liquidity shock phase.
Over the past few weeks, I have mentioned that after the current bear phase I expected a rally into the mid-term elections, roughly following 2018. The primary difference so far is that the May 2018 retest was not a lower low. This would indicate a modest rally into late June, a pullback, then a melt up into Sept-Oct. As discussed below, the June EOQ SPX options OI is showing a similar setup to before the Mar rally. Anyway, given the size of the Jan-May decline of SPX 960 pts, the next bear phase (C wave) is likely to be the panic phase with a 1.62 extension of wave A, and if the rally phase extends to 4500-4550 this would be SPX 3000+/- with the panic coming on a break of the Jan 2020 highs of 3400. Since 2000 there have been four SPX declines of 20%+ before 2022, with 2000-02 lasting 2.5 years, 2008-09 1.5 years, Oct-Dec 2018 5 months and Mar 2020 5 weeks. This time I am expecting at least 2.5 years or possibly even 3-5 years before a final bottom.
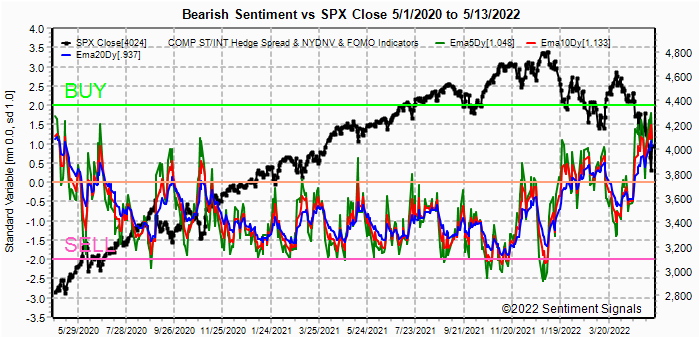
Although most of the LT bearish sentiment does not indicate a bear market bottom, INT/ST sentiment is equal to or higher than the sentiment seen at the Feb lows that produced an SPX rally from 4120 to 4640. If this is the end of phase 1 of a bear market, as much as a 70% retracement of the entire decline is normal and indicates a target in the 4530s. This weeks options OI section includes a look at the EOQ June SPX OI that shows a similar setup to that shown in late Feb. Then a large put position of about 75k puts between 4500-50 were used to project a rally from the low SPX 4100s to 4500+ by the end of Mar and the SPX actually rallied to 4640 before closing EOM at 4550. This time a slightly smaller amount of June puts are between 4300-50, giving that or higher as a target by EOQ June.
I. Sentiment Indicators
The INT/LT Composite indicator (outlook 3 to 6+ months) has three separate components. 1st is the SPX and ETF put-call indicators (30%), 2nd the SPX 2X ETF INT ratio (40%), and 3rd a volatility indicator (30%) which combines the options volatility ratio of the ST SPX (VIX) to the ST VIX (VVIX) with the UVXY $ volume.
Update. Sentiment remains near the Buy level but below that of the Feb SPX bottom, mainly due to SPX ETF sentiment, but extreme NDX sentiment may more than offset the difference. See SM/DM section.

Update. Bearish sentiment matched the highest levels of the last two years at last weeks lows.

Update ST EMAs. Last weeks sentiment remains mostly unchanged with a very ST pullback.

Update. From the LT perspective, sentiment remains below levels seen at important bottoms from 2018-20.

Update ST/INT EMAs. Sentiment is stronger than that seen at the SPX Feb
lows a may mean a stronger and/or longer rally than late Mar.

Update. Using the separate indicators, we see that ETF bearish sentiment has started to increase, but remains very weak.

II. Dumb Money/Smart Money Indicators
This is a new hybrid option/ETF Dumb Money/Smart Money Indicator as a INT/LT term (outlook 2-6 mns) bearish sentiment indicator. The use of ETFs increases the duration (term).
Update. Bearish sentiment has reached the level of Feb 2022, supporting a rally similar to Mar.


Update INT, shows a strong increase in hedging relative to the Feb lows.


III. Options Open Interest
Using Thur closing OI, remember that further out time frames are more likely to change over time, and that closing prices are more likely to be effected. Delta hedging may occur as reinforcement, negative when put support is broken or positive when call resistance is exceeded. This week I will look out thru May 20. A text overlay is used for extreme OI to improve readability, P/C is not changed. A new addition is added for OI $ amounts with breakeven pts (BE) where call & put $ amounts cross, and $ volume for EOD Fri.
With Fri close at SPX 4124, a look at Fri options OI showed SPX remains weak relative to sentiment, barely closing over 4000 support level of 4k net puts.


IV. Technical / Other
This week I just want to look at a couple of volatility indicators, the INT/LT VIX Buy&Sell indicator (SKEW & VIX/VXV) and the ST VIX call indicator. The VIX Buy&Sell indicator remains well below previous INT lows in Feb and Dec 2018 and Mar 2020, but about the same as the Feb 2022 low, meaning a several hundred pt rally is likely, but only as a pause in a larger bear market.

The VIX call indicator is showing a strong Buy, reversing the strong Sell of early Apr.

Conclusions. Last week may have been the end of phase 1 of a larger bear market that could last for several years. Dropping from a peak of SPX peak of 4820 the Thur low at 3860 was similar to the Oct-Dec 2018 decline of 20%, but too many structural problems exist such as supply-chain shortages, a move from off-shoring to on-shoring, and a Fed tightening cycle, to assume that this is more than the beginning of economic problems. The only solution that could quickly turn things around is a resolution to the Russia/Ukraine conflict, but that seems unlikely.
Weekly Trade Alert. Next week could start out with some weakness with a drop to SPX 3950ish, but a rally to SPX 4150 by Fri optn exp close is likely. Another pullback may occur into the EOM, but a strong rally to 4300-50 is expected by EOM June. Updates @mrktsignals.
Investment Diary, Indicator Primer, Tech/Other Refs,
update 2021.07.xx Data Mining Indicators - Update, Summer 2021,
update 2020.02.07 Data Mining Indicators,
update 2019.04.27 Stock Buybacks,
update 2018.03.28 Dumb Money/Smart Money Indicators
Article Index 2019 by Topic, completed thru EOY 2020.02.04
Article Index 2018 by Topic
Article Index 2017 by Topic
Article Index 2016 by Topic
Long term forecasts
© 2022 SentimentSignals.blogspot.com
No comments:
Post a Comment