
Last week's call was a bust. I had been lookng for SPX 4000 by Fri, and when the SPX could not get below 4050 I gave up ST. Tue opened gap down, possibly due to a 0.5% rate increase by the New Zealand CB, and the strong services PMI data in the AM added to concern for those still looking for a Fed pivot. By noon the SPX reached 4000, but too late to do me any good. Continued weakness resulted in a Fri AM low just below 3950. There seemed to be a strong capitulation vibe during the week, but sentiment measures show only modest changes other than an uptick in hedging. BofA's M.Harnett came out for a call for the SPX to drop to 3800 by Mar 8, but I am more inclined to look for 3900 by mid-Mar then a rally back to ~4100 in Apr before a May/Jun trip to 3800 if Powell sticks to only rate hikes of 0.25%.
On a more positive note, I had been very disappointed with the newer releases of Windows 11 due to the changes in the File Explorer and after going thru 6 or 8 versions I found a version released in Japan in Nov 2021 which had the old File Explorer and a compressed WinSxS folder that reduced the install size to about 5gb or the same size as my x32 Win 10. So I am happy and will probably wait to next winter to install all of my custom software.
There are three more FOMC meetings thru June, Mar 21-22, May, 2-3 and Jun 13-14. I expect three more rates of 0.25% to the FF rate of 5.25-5.5% and TNX to 4.5-5%, then a pause of 6-9 mns.
I. Sentiment Indicators
The INT/LT Composite indicator (outlook 3 to 6+ months) has three separate components. 1st is the SPX and ETF put-call indicators (30%), 2nd the SPX 2X ETF INT ratio (40%), and 3rd a volatility indicator (30%) which combines the options volatility ratio of the ST SPX (VIX) to the ST VIX (VVIX) with the UVXY $ volume.
Update Alt. In this case the wts for the SPX 2X ETF ratio (SDS/SSO) and SPX puts & calls spread are adj to equal as in the DM/SM section for SPX ETFs. Bearish sentiment declined slightly with strong BTFD in SPX calls while other components were marginally higher, indicating that the decline is not over.


Update. Bearish sentiment remains near neutral with a strong bounce in UVXY vol, but no sign of NYSE capitulation volume.

Update EMA. Bearish sentiment bounced slightly.

Looking at the VIX Call + SPXADP Indicator for the very ST. A spike in bearish sentiment is likely to result in a counter trend bounce for a few days.

Update EMA. An increase in hedging has increased ST bearish sentiment back to the neutral level.


Update. Much like bonds, the drop in gold miners caused a pickup in buying and a drop in bearish sentiment, indicating that lower prices are likely.

II. Dumb Money/Smart Money Indicators
This is a new hybrid option/ETF Dumb Money/Smart Money Indicator as a INT/LT term (outlook 2-6 mns) bearish sentiment indicator. The use of ETFs increases the duration (term).
Update. Bearish sentiment bounced of the extreme lows of last week which indicated a pullback was likely, but sentiment remains well below levels to support a sustained rally.


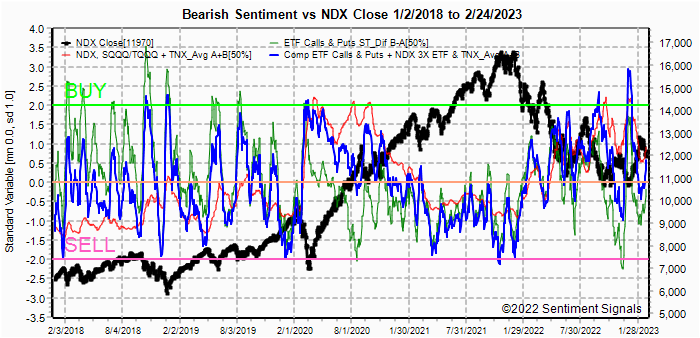
For the NDX combining the hybrid ETF options plus NDX 3X ETF sentiment with the interest rate effect, (outlook 2 to 4 mns) bearish sentiment shows similar extremes between ETF and options as in late 2020 which resulted in a choppy market until options sentiment rose. Note QQQ options are optimal, but are N/A and are included in ETF options.
Bearish sentiment for the NDX remains higher than for the SPX
and should result in relative strength for NDX.
III. Options Open Interest
Using Thur closing OI, remember that further out time frames are more likely to change over time, and that closing prices are more likely to be effected. Delta hedging may occur as reinforcement, negative when put support is broken or positive when call resistance is exceeded. This week I will look out thru Mar 3. A text overlay is used for extreme OI to improve readability, P/C is not changed. A new addition is added for OI $ amounts with breakeven pts (BE) where call & put $ amounts cross.
With Fri close at SPX 3970, options OI for Mon is small with put support at 3950 and a slight positive bias toward call resistance at 4000. Likely positive but small gain by the close.


IV. Technical / Other - N/A
Conclusions. There is not a lot in the sentiment outlook this week to be bullish about. The VIX call and SPXADP very ST indicator does show a weak Buy, however, at +1 SD, so there should be a bounce next week to the SPX 4025-50 level. The 2nd and 3rd weeks have the jobs data followed by CPI/PPI and will likely show strength resulting in a drop in the SPX to 3900. The following weeks FOMC could start a tradeable bounce, possibly to SPX 4100 if Powell sticks to his original plan of 0.25% hikes. One reason I think this is likely is that much of the recent strength in inflation comes from shelter (housing/rents) that are calced on a 12 mn rolling avg, and therefore show lagged data with recent data in a downtrend.
Weekly Trade Alert. This did not work very well last week, but I am again looking for a modest gain of SPX 50-75pts next week before lower lows mid-month. Updates @mrktsignals.
Investment Diary, Indicator Primer, Tech/Other Refs,
update 2021.07.xx Data Mining Indicators - Update, Summer 2021,
update 2020.02.07 Data Mining Indicators,
update 2019.04.27 Stock Buybacks,
update 2018.03.28 Dumb Money/Smart Money Indicators
Article Index 2019 by Topic, completed thru EOY 2020.02.04
Article Index 2018 by Topic
Article Index 2017 by Topic
Article Index 2016 by Topic
Long term forecasts
© 2023 SentimentSignals.blogspot.com
No comments:
Post a Comment