Another successful week, but still full of surprises. The Sun update indicated that the UBS CSuisse buyout would create a more bullish start to the week, and the SPX climbed steadily thru Thur to reach the EOW target of 4000. Wed was expected to be down as the Fed held steady in the inflation fight and raised rates 25BP, even though many including Musk were calling for a "pivot". However, the SPX held steady over 4000 after the rate hike, but after a brief spike to 4040 fell hard the last 90 min to close below 3940. The choppy action between 3900 and 4000 continued thru Fri which rallied steadily from an opening low at 3910 to close at 3970, missing the 4000 target.
Next weeks outlook is for more of the choppy trading, but likely in a tighter range. If June -July 2022 patterns continues we may remain in a range from SPX 3900-4000 until mid-late Apr, while a Fed pause at the May 2-3 FOMC may provide fuel for a move to SPX 4200 or higher thru June. What happens to int rates (TNX) after the Fed pause is likely to be important. If rates continue to rise with the TNX moving to 4%+ then SPX 4200 is a likely maximum. If rates stay near 3.5% then 4300 is likely. A move to 4.5% by Fall due to continued inflation and strong growth probably means a retest of SPX 3800.
The Tech/Other section takes a "big picture" look at int rates (fed funds, TNX) and the PCE inflation gauge for two possible LT scenarios..
I. Sentiment Indicators
The INT/LT Composite indicator (outlook 3 to 6+ months) has three separate components. 1st is the SPX and ETF put-call indicators (40%), 2nd the SPX 2X ETF INT ratio (30%), and 3rd a volatility indicator (30%) which combines the options volatility ratio of the ST SPX (VIX) to the ST VIX (VVIX) with the UVXY $ volume. This week breaks SPX options into volume adj (1/B-A) and traditional spread (A-B).
Update Alt. In this case the wts for the SPX 2X ETF ratio (SDS/SSO) and SPX puts & calls spread are adj to equal as in the DM/SM section for SPX ETFs. Bearish sentiment continued to climb, especially in options, with continued fears of a banking crisis, aka 2008-09, and now resides at neutral.
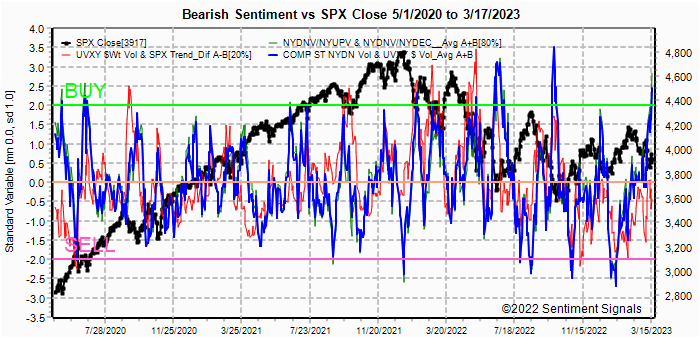
4Update Alt EMA. The brief spike to neutral has pulled back slightly. The ST Composite as a ST (1-4 week) indicator includes the NYSE volume ratio indicator (NYDNV/NYUPV & NYDNV/NYDEC) and the UVXY $ Vol/SPX Trend. Weights are 80%/20%.Update. ST volume sentiment continued to rise sharply, now producing a strong Buy similar to the levels of the June and Sept SPX lows. I still expect continued chopy behavior similar to June-July which saw a range of 3800-900 for a month before a breakout rally.
Update EMA. Here, we also see a strong Buy just below the June levels. The ST/INT Composite indicator (outlook 1 to 3 months) is based on the Hedge Spread (48%) and includes ST Composite (12%) and three options FOMO indicators using SPX (12%), ETF (12%), and Equity (12%) calls compared to the NY ADV/DEC issues (inverted). FOMO is shown when strong call volume is combined with strong NY ADV/DEC. See Investment Diary addition for full discussion.
Update EMA. Here, we see similar but somewhat weaker bearish sentiment than at the June and Sept lows.
Bonds (TNX). Bearish sentiment in bonds remains below neutral and will probably remain in the same trading range. For the INT outlook with LT still negative, the gold miners (HUI) bearish sentiment is presented in a new format using the data mining software to add the inverse TNX rate to the ETF ratio.Update. ETF bearish sentiment fell sharply and may mean limited upside.
II. Dumb Money/Smart Money Indicators
This is a new hybrid option/ETF Dumb Money/Smart Money Indicator as a INT/LT term (outlook 2-6 mns) bearish sentiment indicator. The use of ETFs increases the duration (term). This week a "fix" is included for the SPX low options P/C discussed in the SPX ETF section.
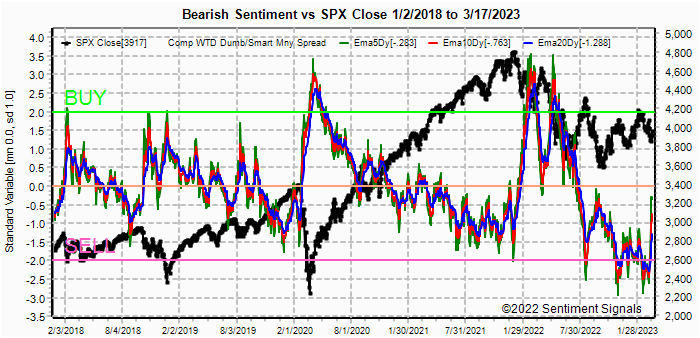
Update. After the "fix", bearish sentiment now appears similar to the Aug 2019 period, where a choppy advance ended in the Jan 2020 meltup.
With the sister options Hedge Spread as a ST/INT indicator (outlook 1-3 mns), bearish sentiment continued to fall to the weak Buy level following the June 2022 pattern. A new composite SPX options indicator uses both the volume adj (1/B-A) and P/C equivalent spread (A-B) to compensate for the discrepancy between the two. This replaces the old SPX options indicator for the SPX ETFs + options below and the INT/LT composite.For the SPX, I am switching to hybrid 2X ETFs plus SPX options. Taking a look at the INT term composite (outlook 2 to 4 mns), bearish sentiment rose above neutral with a sharp rise in options sentiment.
For the NDX combining the hybrid ETF options plus NDX 3X ETF sentiment with the interest rate effect, (outlook 2 to 4 mns) bearish sentiment shows similar extremes between ETF and options as in late 2020 which resulted in a choppy market until options sentiment rose. Note QQQ options are optimal, but are N/A and are included in ETF options.
The 10% rise in the NDX the last two weeks from the 11,800
level resulted in a sharp drop in sentiment and will probably result in more
normal market performance.
III. Options Open Interest
Using Thur closing OI, remember that further out time frames are more likely to change over time, and that closing prices are more likely to be effected. Delta hedging may occur as reinforcement, negative when put support is broken or positive when call resistance is exceeded. This week I will look out thru Mar 31. A text overlay is used for extreme OI to improve readability, P/C is not changed. Also, this week includes a look at the GDX & TLT for Apr exp. A new addition is added for OI $ amounts with breakeven pts (BE) where call & put $ amounts cross.
With Fri close at SPX 3971, options OI for Mon is moderate with strong put support at 3950 and call resistance at 4000, so a tight range 3950-4000 is likely with a close near 3970 .
Wed has very small options O, where SPX has put support a 3900 and call resistance at 4025 and 4065.
For Fri EOM strong OI with outside support/resistance at SPX 3900 and 4025 and mostly straddles in between. Likely range 3950-4000 with small downward bias toward 3950-70.
Using the GDX as a gold miner proxy closing at 31.5 made it over strong resistance at 31, but OI and OI$ indicate a drop to 30 is likely.
Currently the TLT is 106.8 with the TNX at 3.38%, similar to GDX the move over call resistance at 105 is likely to reverse pushing TNX back to 3.5%.
IV. Technical / Other
This week I want to look at the Fed's inflation target using the PCE with the TNX and fed funds rates. The last time the PCE was over 4% was 1990 at the beginning of a recession due to an oil shock from the Iraq invasion of Kuwait. As you can see, until 2015 there was a positive spread between the TNX and PCE which is called the real interest rate. The spread is based on expected inflation and is usually based on what happened the last few years. In the 1990s, people expected a return to high inflation of the 1980s and now we see the opposite where people expect the low inflation of the 2010s. The result was that rates were too high in the 1990s, but are probably too low today which is why I expect higher rates. Note the chart does not include last weeks rate hike.
Looking at 1990, it took 4 years for the PCE to drop to the Feds target
rate of 2% even with a recession. Today with continued signs of a stronger
economy, it could take much longer. So I want to take a look at what I see
as two of the most likely outcomes and what it means for interest rates.
The first (prob 40%) is the 2006-07 prelude to the 2008-09 financial crisis
where fed funds rate rise over 5% and stays there for two years while TNX rises
staying between 4.5-5% until a full-blown financial crisis occurs. The
second is 1998-99 (prob 60%) where the Fed lowered rates (today replaced with QE
& other bailouts), but persistent inflation and strong growth with tech boom
leads to higher TNX and Fed had to raise rates 9 mns later, eventually up to
6.5%. This led to tech crash and an even bigger recession.
Conclusions. Its probably time for a time out. The last two weeks have been fairly wild but if options OI is any indication, next week will be calmer with most of the time spent in the SPX 3925-4000 area.
Weekly Trade Alert. Mon could see a small pullback but SPX OI support is strong at 3950. Fri EOM shows a potential range of 3900-4025, but neutral bias centers around 3950-75. Updates @mrktsignals.
Investment Diary, Indicator Primer, Tech/Other Refs,
update 2021.07.xx Data Mining Indicators - Update, Summer 2021,
update 2020.02.07 Data Mining Indicators,
update 2019.04.27 Stock Buybacks,
update 2018.03.28 Dumb Money/Smart Money Indicators
Article Index 2019 by Topic, completed thru EOY 2020.02.04
Article Index 2018 by Topic
Article Index 2017 by Topic
Article Index 2016 by Topic
Long term forecasts
© 2023 SentimentSignals.blogspot.com


