
For the most part since Dec, I have been sticking to the big picture with the outlook of a beginning of a multi-year bear market (after inflation), trying to avoid the whipsaws seen by many of the bears who switch from calls for a drop to SPX 3000 or lower on every decline and a high of 4300 or higher on every rally. Last week ended up on being one of my best calls of the year even though prices were relatively calm. The outlook was for a move to SPX 3925-75 by EOW with a warning of a probable new low first, and Mon began weak with a drop to 3808 before rallying to 3930 with news of the Fed backing SVB depositors. With Wed options OI showing weak support down to 3825, the SPX then dropped to 3840 with a move up into Thur to meet the 3950+ target for Fri AM exp and a possible drop to 3900 for PM exp.
Many are now looking at the SVB, Silvergate, and Credit Suisse problems as the beginning of a 2008-09 financial crisis, but from my perspective this is more like the LTCM crisis of 1998, where a highly leveraged hedge fund had to be bailed out by the Fed. Later this was looked at as giving the green light to more speculation (BTC up 30% Tue) and a primary driver of the dot-com bubble and bust (will we see bubble#2).
The SPX options component for the INT/LT Composite and SPX ETF+options (DM/SM) is adjusted this weeki for the difference between the sentiment shown by high volume and low P/C ratio discussed last week. Also Tech/Other shows a SPX volume chart reflecting the high volume seen last week as an INT bullish indicator.
I. Sentiment Indicators
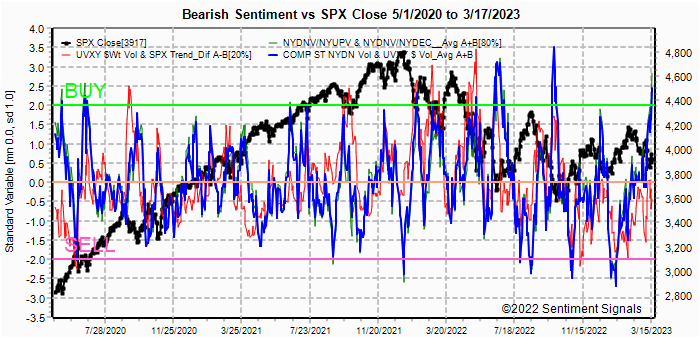
The INT/LT Composite indicator (outlook 3 to 6+ months) has three separate components. 1st is the SPX and ETF put-call indicators (40%), 2nd the SPX 2X ETF INT ratio (30%), and 3rd a volatility indicator (30%) which combines the options volatility ratio of the ST SPX (VIX) to the ST VIX (VVIX) with the UVXY $ volume. This week breaks SPX options into volume adj (1/B-A) and traditional spread (A-B).
Update Alt. In this case the wts for the SPX 2X ETF ratio (SDS/SSO) and SPX puts & calls spread are adj to equal as in the DM/SM section for SPX ETFs. Last week saw an uptick in bearish sentiment roughly equal to the Dec lows at SPX 3800 before a 400 pt rally.


Update. Bearish sentiment has now reached the strong Buy level.
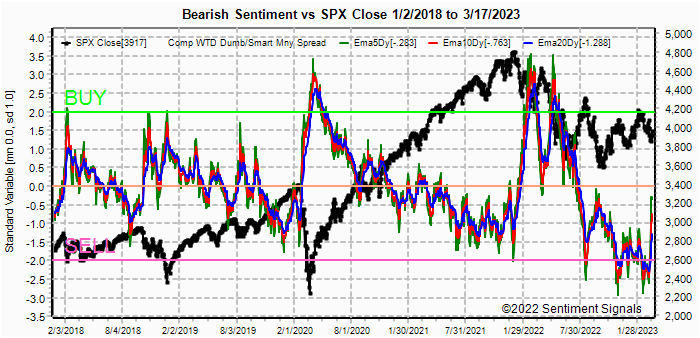
Update EMA. ST remains weaker than Dec lows, while LT remains weak, indicating backing and filling is probable before a large move up.


Update EMA. Weak Buy level reached. Bottom is near, but advance likely to be labored.


Update. Sentiment is near neutral overall, but positive support from ETFS.

II. Dumb Money/Smart Money Indicators
This is a new hybrid option/ETF Dumb Money/Smart Money Indicator as a INT/LT term (outlook 2-6 mns) bearish sentiment indicator. The use of ETFs increases the duration (term).
Update. A surprisingly strong increase in bearish sentiment ST may indicate an INT strong rally (10%+) if LT sentiment continues to improve.


For the NDX combining the hybrid ETF options plus NDX 3X ETF sentiment with the interest rate effect, (outlook 2 to 4 mns) bearish sentiment shows similar extremes between ETF and options as in late 2020 which resulted in a choppy market until options sentiment rose. Note QQQ options are optimal, but are N/A and are included in ETF options.
Update. Last weeks best call was for out-performance by
techs with the NDX up 6% vs SPX 1.5% aided by lower rates. With continued
strength in sentiment, relative strength should continue.

III. Options Open Interest
Using Thur closing OI, remember that further out time frames are more likely to change over time, and that closing prices are more likely to be effected. Delta hedging may occur as reinforcement, negative when put support is broken or positive when call resistance is exceeded. This week I will look out thru Mar 24. A text overlay is used for extreme OI to improve readability, P/C is not changed. A new addition is added for OI $ amounts with breakeven pts (BE) where call & put $ amounts cross and $ volume.
With Fri close at SPX 3917, options OI for Mon is small with BE only slightly above current levels. A successful deal for Credit-Suisse could push prices over 3950, otherwise a close between 3925-50 is likely.


For Fri EOM strong put support does not start until SPX 3900, so lower lows can be seen thru the last week of Mar. There is also very strong call resistance at 4065, likely from the JPM hedge fund. The BE at 4000 indicates prices likely to close between 3975-4000.

IV. Technical / Other
Last week saw very strong volume in SPX, just below the 2 SD Buy level and the highest since June of 2020 so a strong rally of 10%+ may be near. Most of the week was about 50% above ST avg of 2.4B shares while Fri was 5.4B.

Conclusions. Next week is FOMC Tue-Wed and the price behavior Fri seemed to reflect more hope of a "pivot", but I am going to stick with 2-3 more 25PB hikes based on the strong inflation numbers and the EU 50BP hike. The markets may be temporarily dissappointed, but options OI indicates a small range of SPX 3925-75 and Fri suggests a move up to the 4000 level from any pullback. Many of the sentiment indicators are now indicating that there is support building for a strong rally of 10%+ from the SPX 3808 lows or about 4200, but that some bottoming (3900-4000) may be required before more progress.
Weekly Trade Alert. Not much indication of volatility this week, but a pullback on FOMC Wed toward 3925 may target SPX 4000 Fri. Updates @mrktsignals.
Investment Diary, Indicator Primer, Tech/Other Refs,
update 2021.07.xx Data Mining Indicators - Update, Summer 2021,
update 2020.02.07 Data Mining Indicators,
update 2019.04.27 Stock Buybacks,
update 2018.03.28 Dumb Money/Smart Money Indicators
Article Index 2019 by Topic, completed thru EOY 2020.02.04
Article Index 2018 by Topic
Article Index 2017 by Topic
Article Index 2016 by Topic
Long term forecasts
© 2023 SentimentSignals.blogspot.com
Lending to consumers and businesses is currently imploding in the US, so I would say that a US recession actually started last week (big change to the "no landing" scenario just two weeks ago). All those small and medium sized banks are putting all the lending on hold because they want to shore up their balance sheets.
ReplyDeleteThe markets, like oil and the stock market, are coming to grips with this, but I highly doubt it's fully discounted yet. In the meanwhile, this feels like 2018 all over again. The Fed and the ECB are going to play though guy first (because of still high inflation), and the markets needs to do a tantrum once again to stop the central banks. With a S&P around 4000, and 10y Treasury at 3.4 they won't. But they might with a S&P around 3300 and a 10y at 2.25.