
Last week was overall somewhat weaker than expected, but mostly within the target range of SPX 4450-4550. The early bounce to SPX 4500+ (4518) only lasted a day as weak data from China Tue set a negative tone to the market and took prices back to the 4470s. Weakness lasted thru Wed with the expected CPI rally lasting only about an hour, but did hit the target zone of SPX 4520-40 (4527). A disastrous 30 yr T-Bond auction Thur sent the LT bond int rates back to test the prior weeks highs and reversed the SPX 55 pt gain to a 15 pt loss by EOD. Higher PPI data Fri pressured TNX rates on Fri, causing an SPX 15 pt loss for the week. On a positive note the SPX did bounce off its 50 SMA and filled a gap at 4445-50. The question is will the gap at SPX 4550-65 be filled before a larger down leg? The bad news is that bond sentiment (TBT/TLT) is little changed and I am getting the same feeling I had in mid-2021 right before TNX rates rose from 1% to 3%.
Today I want to look at three possible outcomes for the next 3-6 mns. The first (prob 40%) is the contrarian view based on what I see sentiment wise. I do think the will be a fill of the gap at SPX 4550-65, but sentiment is currently too weak and a consolidation is likely to last thru Aug (range 4440-4500) similar to Apr-May. Then Sept with triple witch, FOMC and EOQ the gap is filled. The high risk period is mid-Oct to mid-Dec when inflation pressure and rising rates accelerate and EPS continues to disappoint, pushing the SPX toward the 4100 area (top of A). Second is the crash scenario (30%) for me the reason is rates continue to rise due to higher inflation and new Treasury sales, pressuring Techs with the TNX rising to 5-5.5% by EOY and the NDX filling a large gap around 13.5K and the SPX down about 15%. Avi has a similar view, probably supported by an expected banking crisis. In Avi's case the SPX rises to 4550-65 for Aug optn exp, then down to 3800 by mid-Dec. The third case which I call the traditional view (30%) is a decline into Sept-Oct to about SPX 4300 then a rally into EOY to 4700-4800. Here we have EW's Dr Schure (no J/S,reload) and TA's ExecSpec.
Bond market sentiment is my biggest concern. An interesting article in ZH discussed some interesting divergences between futures (TN) and options (TLT) which agreed with the extreme retail bullishness shown in the TBT/TLT sentiment indicator. Otherwise sentiment is improving for the SPX/NDX but does not indicate a strong turnaround for optn exp week. Due to the possible influence of the Dow Theory a look at DJIA futures (YM) is included in the Tech/Other section. The easiest way to view in COT is to edit url replacing ES with YM and return. An additional link is added to Other links for Marketwatch news releases (note Wed).
I. Sentiment Indicators
The INT/LT Composite indicator (outlook 3 to 6+ months) has three separate components. 1st is the SPX and ETF put-call indicators (40%), 2nd the SPX 2X ETF INT ratio (30%), and 3rd a volatility indicator (30%) which combines the options volatility spread of the ST SPX (VIX) to the ST VIX (VVIX) with the UVXY $ volume. This week breaks SPX options into volume adj (1/B-A) and traditional spread (A-B).
Update Alt. In this case the wts for the SPX 2X ETF ratio (SDS/SSO) and SPX puts & calls spread are adj to equal as in the DM/SM section for SPX ETFs. Bearish sentiment declined slightly mainly due to SPX options.


Update. Bearish sentiment has barely touched the weak Buy level.
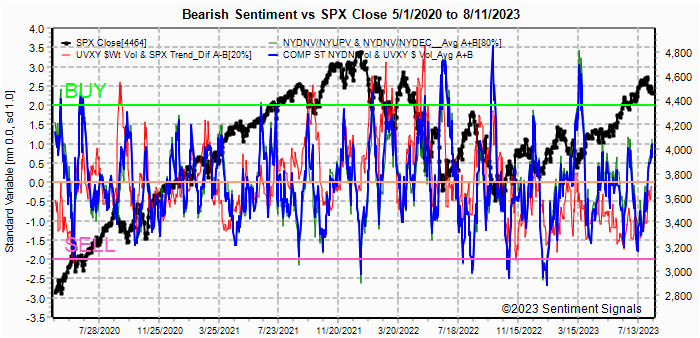
Update EMA. Bearish sentiment ST EMAs are just above neutral and suggest more consolidation similar to Apr-May.

Update EMA. Bearish sentiment continues to rise now above the weak Sell but still below neutral, the level that supported most rallies in late 2020-21.


Update. Bearish sentiment fell sharply and seems to continue to follow the mid-2018 analog. Probably the uptick in inflation excites the PM bulls, but the negative interest rate effect should not be ignored. If inflation and TNX rates continue to rise thru EOY, Fed will likely begin increasing ST rates killing PMs.

II. Dumb Money/Smart Money Indicators
This is a new hybrid option/ETF Dumb Money/Smart Money Indicator as a INT/LT term (outlook 2-6 mns) bearish sentiment indicator. The use of ETFs increases the duration (term).
Update. Bearish sentiment is little changed.


For the SPX, I am switching to hybrid 2X ETFs plus SPX options. Taking a look at the INT term composite (outlook 2 to 4 mns), bearish sentiment fell slightly due to options extremes (0DTE effect?), while EFT sentiment is neutral.

Bearish sentiment rose to the weak Sell level on the back of ETF option
sentiment while NDX ETF sentiment is little changed.

III. Options Open Interest
Using Thur closing OI, remember that further out time frames are more likely to change over time, and that closing prices are more likely to be effected. Delta hedging may occur as reinforcement, negative when put support is broken or positive when call resistance is exceeded. This week I will look out thru Aug 18. A text overlay is used for extreme OI to improve readability, P/C is not changed. Also, this week includes a look at the GDX for Dec exp. A new addition is added for OI $ amounts with breakeven pts (BE) where call & put $ amounts cross.
With Fri close at SPX 4464, options OI for Mon is moderate and shows some support for a rally to 4500, but there is little support until 4425.


For Fri PM moderate SPX OI levels with deep ITM calls skewing $ amounts, most likely target 4450-4525..

IV. Technical / Other
The following uses barcharts.com as a source and discusses S&P futures (ES) as a third venue of stock sentiment in addition to options and ETFs. The non-commercial/commercial spread represents a LT bearish sentiment (dumb money/smart money) indicator. As explained in investopedia, commercial investors (red) are institutions and are smart money, while non-commercials (green) are speculators such as hedge funds and are dumb money. Here is the current barchart graph for the S&P 500 (top) and trader positions (1st bot) with positives as net longs and negatives as net shorts. Bearish sentiment is represented by the spread and is positive if red > green (Buy) and negative if green > red (Sell). ES sentiment is neutral, but lower for the week at < +1 SD, YM (DJIA) is neutral at -0.1 SD, Dow theory may keep DJIA up thru Sept-Oct, watch for Sell at -1 to -2 SD.
Click dropdown list to select from the following options:
Tech / Other History2023
2022
Other Indicators
Conclusions. Bearish sentiment for stocks is rising, but does
not indicate a strong rally next week. .Stocks, esp techs, will continued to be
pressured if rates continue to rise. Athough the SPX found support at its
50 SMA, NDX did not, and may indicate a problem. The DJIA continues to be
the stalwart and seems to bounce strongly every time 35k is tested. If the
DJIA remains strong,losses should be limited, but below the 34.7k level
problems may occur.
Weekly Trade Alert. Not expecting much action next week with the
SPX remaining in the 4440-4500 range unless bonds break down with TNX above
4.25-4.33%. Fri may see a late bounce over SPX 4500 if rates remain calm. Updates @mrktsignals.
Investment Diary,
Indicator Primer,
Tech/Other Refs,
update 2021.07.xx
Data Mining Indicators - Update, Summer 2021,
update 2020.02.07 Data Mining Indicators,
update 2019.04.27 Stock Buybacks,
update 2018.03.28 Dumb Money/Smart Money Indicators
Article Index 2019 by Topic, completed thru EOY 2020.02.04
Article Index 2018 by Topic
Article Index 2017 by Topic
Article Index 2016 by Topic
Long term forecasts
© 2023 SentimentSignals.blogspot.com
Thanks for the analysis as usual Arthur, always a treat.
ReplyDeleteI'll go with the traditional view this time, a correction to about S&P 4300, then another run up to the old highs of 4800. I was quite surprised how the market took the additional treasury offerings in the last few months; but they were just simply offset by a reduction in the excess liquidity pool of the REPO account. Banks who are in trouble are just simply helped by the Fed's tools, so that also doesn't seem to be an issue anymore that the market cares about. The bullishness from the 4630 high just needs te be reset by a 'normal' correction which is underway. I think it's too early for the real bear case; one of the reasons being the mentioned extreme shorting of Treasuries.