
Last week about the only thing I got right was the market direction, which was up. The outlook was for a gradual price increase with a stronger finish as the EOM options and jobs report were expected catalyst, but the Tue weak consumer confidence and job openings sent int rates tumbling and lit a fire under techs, pushing the SPX up to the 4500 area. At least the "handle" for the cup and handle for the TNX was confirmed. A moderate advance continued thru Fri with an early high at SPX 4540 on the initial reaction of the unemployment rate increasing to 3.8% for Aug, but was later faded to close at 4516 after the higher UR was seen to be due to an additional 700K seeking employment. No exact cause was given, but a similar increase occurred in 2022 and was a one time event. This seems likely to be the result of some parents taking the summer off work due to the high cost of child care, then returning to work when the school year resumes.
On the negative side oil prices jumped to $86 Fri on news that OPEC will continue to cut production, putting the screws to Biden for using the SPR for two years to keep prices low in order to punish Russia for invading Ukraine. This likely means higher inflation and higher int rates in the months ahead. With the TNX cup and handle seemingly confirmed, I am raising the probability for my main outlook for a gap fill at SPX 4560-75 to 70% with a 50% prob of a move to 4600-50. A partial retracement down to about SPX 4450 seems likely the next two weeks, while a final leg higher can occur during opt exp week, but will more likely stretch into the FOMC the following week with an expected "no rate hike", or EOM-EOQ window dressing. If the SPX reaches 4600-50. most will see this as confirmation for a more immediate move to SPX 4800+, setting the stage for a contrarian selloff into Dec. The alt scenario (30%) is the EW outlook by Avi and Dr. Schure (no J/S,reload) for either a concluding 3-3-5 flat and a retest of the SPX 4300 area or the completion of an impulse (5-waves up) to confirm a move to 4800+ this year.
Of the ST indicators, both ST Composite and VIX Call & SPXADP indicators have moved to a weak Sell, while the ST/INT Composite indicator has also moved to a weak Sell. Everywhere I turn almost everyone is recommending buying bonds (most of WS) and this week even M.Hulbert, usually a contrarian, says that bonds will outperform stocks for years. However, my lonely TBT/TLT indicator remains on a Sell and I am feeling similar to Dec 2021 when everyone expected the SPX to reach 5000 by Q2 2022.
I. Sentiment Indicators
The INT/LT Composite indicator (outlook 3 to 6+ months) has three separate components. Starting Aug 26, 2023 SPX options are removed due to extreme 0DTE volume distortions. New weights are ETF put-call indicator (30%), SPX 2X ETF INT ratio (40%), and 3rd a volatility indicator (30%) which combines the options volatility spread of the ST SPX (VIX) to the ST VIX (VVIX) with the UVXY $ volume.
Update Alt. Bearish sentiment remains near the neutral area.


Update. Bearish sentiment has completely reversed from a weak Buy last week to a weak Sell.

Update EMA. Bearish sentiment reached a Sell level ST (grn) mid-week, but closed near neutral. More weakness is expected.

VIX Call & SPXADP indicator. Bearish sentiment has dropped from a near strong Buy to a weak Sell.

Update EMA. Bearish sentiment has moved to a weak Sell.


Update. Bearish sentiment continues to be high but weakness in China (SSEC) remains an impediment. A mid-2018 scenario remains a possibility.

II. Dumb Money/Smart Money Indicators
This is a new hybrid option/ETF Dumb Money/Smart Money Indicator as a INT/LT term (outlook 2-6 mns) bearish sentiment indicator. The use of ETFs increases the duration (term).
Update. Bearish sentiment remains near the weak Sell area.


For the SPX, I am switching to hybrid 2X ETFs plus SPX options. Taking a look at the
INT term composite (outlook 2 to 4 mns), bearish sentiment remains near the
weak Sell due to SPX 0DTE options, while SPX ETFS are neutral.

Bearish sentiment is near neutral, with NDX ETFs at the weak Sell area, but
ETF options are at a weak Buy.

Bearish sentiment for SPX is more bullish than for NDX.

III. Options Open Interest
Using Thur closing OI, remember that further out time frames are more likely to change over time, and that closing prices are more likely to be effected. Delta hedging may occur as reinforcement, negative when put support is broken or positive when call resistance is exceeded. This week I will look out thru Sept 8. A text overlay is used for extreme OI to improve readability, P/C is not changed. Also, this week includes a look at the GDX for Dec exp. A new addition is added for OI $ amounts with breakeven pts (BE) where call & put $ amounts crossand $ volume.
With Fri close at SPX 4516, options OI for Tue is moderate with a negative OI$ bias and a large straddle at 4500. Expect SPX 4500 or slightly lower.


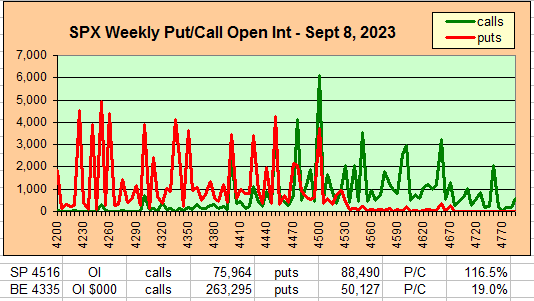
For opt exp Fri PM strong SPX call resistance down to 4450 a put support at 4400 indicates 4450 or lower is likely.

IV. Technical / Other
The following uses barcharts.com as a source and discusses S&P futures (ES) as a third venue of stock sentiment in addition to options and ETFs. The non-commercial/commercial spread represents a LT bearish sentiment (dumb money/smart money) indicator. As explained in investopedia, commercial investors (red) are institutions and are smart money, while non-commercials (green) are speculators such as hedge funds and are dumb money. Here is the current barchart graph for the S&P 500 (top) and trader positions (1st bot) with positives as net longs and negatives as net shorts. Bearish sentiment is represented by the spread and is positive if red > green (Buy) and negative if green > red (Sell). ES sentiment is neutral at +.5 SD, YM (DJIA) is at neutral at +.5 SD, Dow theory may keep DJIA up thru Sept-Oct, watch for Sell at -1 to -2 SD.
Click dropdown list to select from the following options:
Tech / Other History2023
2022
Other Indicators
Conclusions. Sentiment was positive for last week, but the gains in SPX
exceeded expectations as weak economic data fueled a drop in interest rates and
speculation that the Fed would pause its rate hikes at the Sept 19-20 meeting.
The move to SPX 4540 was enough to generate ST Sells on several indicators
although the Hedge Spread remains on an INT Buy.
Weekly Trade Alert. A pullback to SPX 4450 or
lower is likely by mid-Sept, but a move higher to at least 4550-65 is still
likely before a more significant top. Updates @mrktsignals.
Investment Diary,
Indicator Primer,
Tech/Other Refs,
update 2021.07.xx
Data Mining Indicators - Update, Summer 2021,
update 2020.02.07 Data Mining Indicators,
update 2019.04.27 Stock Buybacks,
update 2018.03.28 Dumb Money/Smart Money Indicators
Article Index 2019 by Topic, completed thru EOY 2020.02.04
Article Index 2018 by Topic
Article Index 2017 by Topic
Article Index 2016 by Topic
Long term forecasts
© 2023 SentimentSignals.blogspot.com
No comments:
Post a Comment