
Last weeks ST Sell signal from the ST Composite and VIX Call & SPXADP indicators worked better than expected starting with Mon manufacturing PMI which showed a surprise expansion (>50%) and soaring input prices. The manuf sector had been in contraction for a year & a half and was the last bastion for the call for large Fed rate cuts to prevent a recession - the result was soaring int rates. After a retest of last weeks SPX highs (5265) at the open (5264), prices dropped about .5%, but Tue open gapped down to below 5200 (5184) as Israel bombed an Iran embassy in Damascus O/N, killing a top IRGC commander with fears of war between Iran and Israel. The SPX then recovered to 5250 by mid-day Thur, but a late selloff took prices as low as 5145 as rumors spread of an imminent retaliation by Iran against Israel or the US. As Fri made it back above 5200 with jobs data close to expectations, the outlook for a range of SPX weekly range of 5200-50 after a higher open was not too bad, but a little conservative for the lows.
Interestingly, the move to SPX 5150 coincided with Avi's outlook for a wave iv low with the outlook for a major top around 5350 options exp week Apr 17-19. The large drop Thur may have also been aided by an apparent of the breakdown of the SPX diagonal since last Oct, although as pointed out before the DJIA diagonal broke down early March and resulted only in a trading range, and ditto for the NDX diagonal for over a week. The next few weeks should be telling, but I am expecting disappointment for the bears.
This weeks headlines are CPI/PPI on Wed/Thur. Rising oil prices may take a month or two to show up in headline inflation and this weeks data is expected to be benign with CPI at .3% vs prior .4% MOM with same for core. Core is expected to remain high at 3.7% YOY vs prior 3.8%. Volatility is more likely to come from Israel/Iran. One change in the COT data was ES (SPX) that went from weak Buy to neutral.
I. Sentiment Indicators
The INT/LT Composite indicator (outlook 3 to 6+ months) has three separate components. Starting Aug 26, 2023 SPX options are removed due to extreme 0DTE volume distortions. New weights are ETF put-call indicator (30%), SPX 2X ETF INT ratio (40%), and 3rd a volatility indicator (30%) which combines the options volatility spread of the ST SPX (VIX) to the ST VIX (VVIX) with the UVXY $ volume.
Update Alt, INT view. Bearish sentiment remains the same at a slightly positive +.5 SD.


Update. Bearish sentiment reversed back above neutral.


Update EMA. Bearish sentiment remains just below neutral.


Update. Bearish sentiment for the HUI via ETFs has been rising as prices broke above the 250 resistance area and is usually a bullish sign.

II. Dumb Money/Smart Money Indicators
This is a new hybrid option/ETF Dumb Money/Smart Money Indicator as a INT/LT term (outlook 2-6 mns) bearish sentiment indicator. The use of ETFs increases the duration (term).
Update. Bearish sentiment moved up sharply from the weak Sell to just below neutral.


For the SPX, I am switching to hybrid 2X ETFs plus SPX options. Taking a look at the INT term composite (outlook 2 to 4 mns), bearish sentiment continues to inch lower, now just below the weak Sell.

Bearish sentiment fell back toward neutral.

Bearish sentiment for SPX remains close to a weak Buy.

III. Options Open Interest
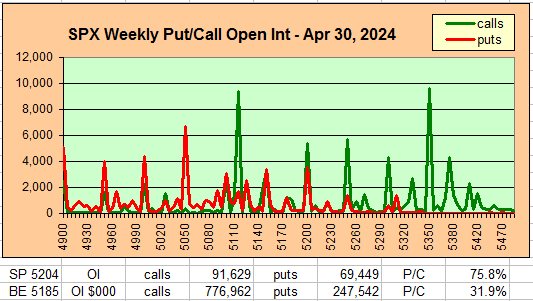
Using Thur closing OI, remember that further out time frames are more likely to change over time, and that closing prices are more likely to be effected. Delta hedging may occur as reinforcement, negative when put support is broken or positive when call resistance is exceeded. This week I will look out thru Apr 12. A text overlay is used for extreme OI to improve readability, P/C is not changed. A new addition is added for OI $ amounts with breakeven pts (BE) where call & put $ amounts cross.
With Fri close at SPX 5204, options OI for Mon is moderate with strong put support at 5200. Small call resistance at 5225 may limit advances, but over 5225 next resistance is 5250.


IV. Technical / Other
The following uses barcharts.com as a source and discusses S&P futures (ES) as a third venue of stock sentiment in addition to options and ETFs. The non-commercial/commercial spread represents a LT bearish sentiment (dumb money/smart money) indicator. As explained in investopedia, commercial investors (red) are institutions and are smart money, while non-commercials (green) are speculators such as hedge funds and are dumb money. Here is the current barchart graph for the S&P 500 (top) and trader positions (1st bot) with positives as net longs and negatives as net shorts. Bearish sentiment is represented by the spread and is positive if red > green (Buy) and negative if green > red (Sell). ES (SPX) sentiment dropped to neutral at +0.5 SD, NQ (NDX) remained neutral at 0.0 SD, YM (DJIA) is a moderate Sell at -1.75 SD, Dow theory no longer supports DJIA.
Click dropdown list to select from the following options:
Tech / Other History2024
2023
2022
Other Indicators
Conclusions. Sentiment overall saw a major improvement last week, but only back to a more neutral position. Increasing inflation pressure and problems in the middle east will remain a major source of concern and volatility. An INT trading range does look more like a possibility, first with the DJIA and then the NDX, but we will have to see how the SPX performs.
Weekly Trade Alert. Next week looks like it should have a positive start to SPX 5225-50 with CPI/PPI uncertainty mid-week and EOW target 5175-5200. Updates @mrktsignals.
Investment Diary,
Indicator Primer,
Tech/Other Refs,
update 2021.07.xx
Data Mining Indicators - Update, Summer 2021,
update 2020.02.07 Data Mining Indicators,
update 2019.04.27 Stock Buybacks,
update 2018.03.28 Dumb Money/Smart Money Indicators
Article Index 2019 by Topic, completed thru EOY 2020.02.04
Article Index 2018 by Topic
Article Index 2017 by Topic
Article Index 2016 by Topic
Long term forecasts
© 2024 SentimentSignals.blogspot.com
No comments:
Post a Comment