Last weeks outlook for a modest pullback before a move back over
SPX 6000 fell flat as the Trump party celebrated all week pushing the SPX over
6100 although the Trump and Melania memes fell more than 50%. So far the
SPX is performing much as it did in Nov-Dec 2021 where a one month decline was
reversed in just a few days to the low 4700s after a test of the 100D SMA, this
time filling the post-election gap at 5780. If comparisons continue there
could be another test of the 100D SMA before a longer breakout over 6100.
On the news front an overlooked item could spell big trouble for the mega cap AI
tech sector. The US has been trying to block Chinas AI development by
limiting the export of advanced AI chips, notably NVDAs H-100 which runs on
propriety CUDA software. However, last week a China tech firm announced a
new AI product called DeepSeek-R1 (no J/S) which is
competitive performance wise with the most advanced US products, but runs on
less advanced chips at about 10% of the cost and power usage by using a more
advanced modeling language.
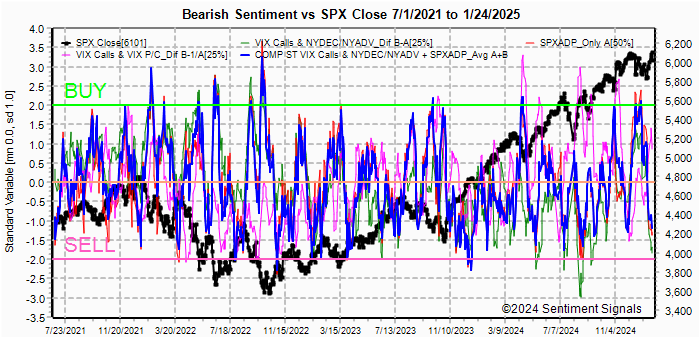
Several of the INT and ST indicators, including Hedge Spread, options FOMO
and VIX & SPXADP indicators, are at levels suggesting a ST pullback toward the
SPX 5800 is likely over the next few weeks. In the Tech/Other section, an
update of LT SKEW and NYSE Adv/Dec volume shows that an INT top is likely in the
next several months with the NYSE volume reaching a Sell (100D EMA < 1.5) and
SKEW at record highs.
I. Sentiment Indicators
The INT/LT Composite indicator (outlook 3 to 6+ months) has three separate
components. Starting Aug 26, 2023 SPX options are removed due to extreme 0DTE volume
distortions. New weights are ETF put-call indicator (30%), SPX 2X ETF INT
ratio (40%), and 3rd a volatility indicator (30%) which combines the options
volatility spread of the ST SPX (VIX) to the ST VIX (VVIX) with the UVXY $ volume.
Update Alt, INT view. Bearish sentiment fell sharply from below neutral to
between the weak and strong Sells with a sharp decline in ETF P/Cs (hedging).
Update INT volatility. Bearish sentiment also nose-dived from above a weak
Sell to below.
Update Alt EMA. Bearish sentiment fell toward a strong Sell.
The ST Composite as a ST (1-4 week) indicator includes the NYSE volume ratio
indicator (NYDNV/NYUPV & NYDNV/NYDEC) and the UVXY $ Vol/[SPX Trend, SMA only]. Weights
are 80%/20%.
Update. Bearish sentiment surprisingly remains near neutral, so a few days
around 6100 is possible.
Update EMA. Bearish sentiment is little changed.
The ST VIX calls and SPXADP indicator bearish sentiment continues to fall,
but still near a weak Buy.
The ST/INT Composite indicator (outlook 1 to 3 months) is based on the Hedge Spread (48%)
and includes ST Composite (12%) and three options FOMO indicators using SPX (12%),
ETF (12%), and Equity (12%) calls compared to the NY ADV/DEC issues (inverted). FOMO
is shown when strong call volume is combined with strong NY ADV/DEC. See
Investment Diary
addition for full discussion.
Update EMA. Bearish sentiment fell below a strong Sell with the LT (blu)
matching the Nov 2021 level with strong FOMO and weak hedging leading the way.
Update FOMO. Bearish sentiment continues to fall toward a strong Sell.
Bonds (TNX). Bearish sentiment remains at low extremes as TNX
briefly dropped toward 4.5%.
For the INT outlook, the gold miners (HUI) bearish
sentiment is presented in a new format using the data mining software to add
the inverse TNX rate to the ETF ratio.
Update. Bearish sentiment continued to rise with the HUI, ETF sentiment
moved over neutral but remains below a weak Buy.
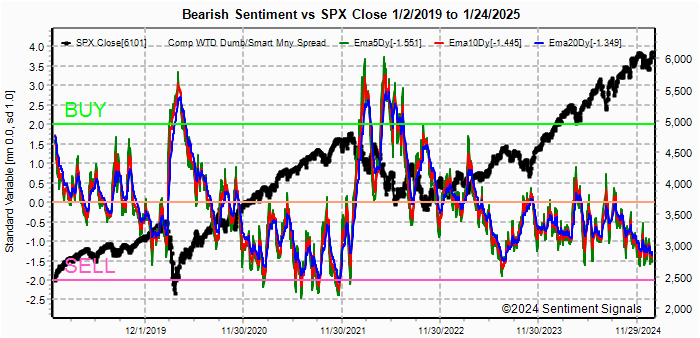
II. Dumb Money/Smart Money Indicators
This is a new hybrid option/ETF Dumb Money/Smart Money Indicator as a INT/LT
term (outlook 2-6 mns) bearish sentiment indicator. The use of ETFs
increases the duration (term).
Update. Bearish sentiment increased slightly.
With the sister options Hedge Spread as a ST/INT indicator
(outlook 1-3 mns), bearish sentiment VST (grn) fell sharply from a weak Sell
to a strong Sell.
A new composite SPX options indicator uses both the volume adj (1/B-A) and P/C
equivalent spread (A-B) to compensate for the discrepancy between the two.
This replaces the old SPX options indicator for the SPX ETFs + options below and the
INT/LT composite. No chart.
For the SPX, I am switching to hybrid 2X ETFs plus SPX options. Taking a look at the
INT term composite (outlook 2 to 4 mns), bearish sentiment fell below neutral.
For the NDX combining the hybrid ETF options plus NDX 3X ETF sentiment with the interest rate effect,
(outlook 2 to 4 mns) bearish sentiment shows similar extremes between ETF and
options as in late 2020 which resulted in a choppy market until options
sentiment rose. Note QQQ options are optimal, but are N/A and are included
in ETF options.
Bearish sentiment fell sharply from a weak to a strong Sell with the sharp
decline in ETF P/Cs (hedging).
For the SPX combining the hybrid ETF options plus SPX 2X ETF (outlook 2 to 4 mns)
produces an indicator where, in this case, ETF options are a proxy for the SPY options.
Bearish sentiment for SPX fell from above a weak Sell to near a strong Sell
III. Options Open Interest
Using Thur closing OI, remember that further out time frames are more likely
to change over time, and that closing prices are more likely to be effected.
Delta hedging may occur as reinforcement, negative when put support is broken
or positive when call resistance is exceeded. This week I will look
out thru Jan 31. A text overlay is used for extreme OI to improve readability,
P/C is not changed. Also, this week includes a look at the GDX for Dec exp.
A new addition is added for OI $ amounts with breakeven pts (BE) where
call & put $ amounts cross. Note multiply OI$ by 100 for shares/contract.
With Fri close at SPX 6101, options OI for Mon is moderate with many OTM P&Cs.
Over 6100 could push higher but below targets 6080.
Wed has smaller OI where SPX could trade between 6050 and 6100.
For Fri EOM, stronger SPX $OI should create downward pressure toward 6000
(straddle) and 6025 (call resistance). Likely to create downward pressure
earlier in week.
For Feb 21 AM strong SPX OI indicates sttrong resistance over 6100 with
attraction to large straddle (P&C about 39k) at 6000.
IV. Technical / Other
Oct 2018 topped with SKEW at ATH of 150, 2021 H2 at 160, and now we are at 170.
Lead times have varied, but usually several months.
The SPX price performance since the CPI report mid-Jan was impressive, but the
volume has lagged and the NYSE Adv/Dec volume 100D EMA (red) crossed below the
Sell level at 1.5. Something similar occurred in Nov-Dec 2021 prior to the
Jan 2022 top, so an INT top may be closer than originally expected. Watch
for a second test of the 100D SMA (SPX 5800-50) and a final burst over 6100
(6250+).
The following uses barcharts.com as a source and discusses S&P futures (ES) as a third
venue of stock sentiment in addition to options and ETFs. The non-commercial/commercial
spread represents a LT bearish sentiment (dumb money/smart money) indicator. As explained in investopedia,
commercial investors (red) are institutions and are smart money, while non-commercials (green) are speculators such as
hedge funds and are dumb money. Here is the current barchart graph
for the S&P 500 (top) and trader positions (1st bot) with positives as net longs and negatives
as net shorts.
Bearish sentiment is represented by the spread and is positive if red > green
(Buy) and negative if green > red (Sell). ES (SPX) sentiment remains
at neutral 0.0 SD, NQ (NDX) bearish sentiment is between a weak and strong Sell at -1.75 SD, YM (DJIA)
remains below neutral at -0.5 SD.
Click dropdown list to select from the following options:
Tech / Other History
2024
2023
2022
Other Indicators
Conclusions. The stock markets acceleration to the upside last week
created considerable capitulation by the bears. One of the more bullish
outlooks is by an EW analyst Dr. Schure who is
expecting the SPX to reach 6400-500 in Feb, but I remain more cautious and favor
the expanded flat for a couple more months.
Weekly Trade Alert. Below SPX is an important inflection area and
could lead to a drop to SPX 6000-25 by EOM (Fri). Updates @mrktsignals.
After some early weakness Mon AM below the SPX 5800 level (5770) as
expected, the SPX rallied about 100 pts into the close. Tue was a
consolidation day, trading in a 50 pt range as concern over a possible uptick in
inflation (CPI/PPI) and rising rates kept investors in check, but the Wed AM CPI
release which was stronger than expected at 0.4%/mn was followed by a sigh
of relief as the "core inflation" (less food and energy) dropped to 0.2%/mn.
What followed was a second 100 pt rally, mostly a gap open, a consolidation Thur
and another gap open on Fri with a move over SPX 6000 to follow. The
target for the week was SPX 5950 or 3% and instead we got 4% from the lows.
Unfortunately with most of the gains on gap opens there was less
participation and many sentiment indicators were little changed. A couple
of other analyst I follow who were looking for SPX 5500-600 in Jan-Feb are now
looking for 6500-600 by mid-year. Fri move up ti SPX 6000 did see a jump
in VIX call buying to 3x daily avg, so a small pulback to possibly fill the Fri
gap at 5940 seems likely as indicated by this weeks options OI, but a retest of
6000+ is likely by EOM.
One of the newer indicators, options FOMO, as part of the ST/INT Composite
has performed better than expected compared to other indicators that were
negatively affected by the high 0DTE option volume and is shown after the
composite..
I. Sentiment Indicators
The INT/LT Composite indicator (outlook 3 to 6+ months) has three separate
components. Starting Aug 26, 2023 SPX options are removed due to extreme 0DTE volume
distortions. New weights are ETF put-call indicator (30%), SPX 2X ETF INT
ratio (40%), and 3rd a volatility indicator (30%) which combines the options
volatility spread of the ST SPX (VIX) to the ST VIX (VVIX) with the UVXY $ volume.
Update Alt, INT view. Bearish sentiment remains between neutral and a weak
Sell.
Update Alt EMA. Bearish sentiment VST (grn) has fallen to the weak Sell.
The ST Composite as a ST (1-4 week) indicator includes the NYSE volume ratio
indicator (NYDNV/NYUPV & NYDNV/NYDEC) and the UVXY $ Vol/[SPX Trend, SMA only]. Weights
are 80%/20%.
Update. Bearish sentiment declined from near a weak Buy Mon to neutral.
Update EMA. Bearish sentiment fell below neutral.
The ST VIX calls and SPXADP indicator bearish sentiment saw a sharp drop late
in the week with strong VIX call Buying to near a weak Sell.
The ST/INT Composite indicator (outlook 1 to 3 months) is based on the Hedge Spread (48%)
and includes ST Composite (12%) and three options FOMO indicators using SPX (12%),
ETF (12%), and Equity (12%) calls compared to the NY ADV/DEC issues (inverted). FOMO
is shown when strong call volume is combined with strong NY ADV/DEC. See
Investment Diary
addition for full discussion.
Update EMA. Bearish sentiment reversed sharply from above a weak Sell to
near a strong Sell based on strong FOMO (call buying) as shown in the 2nd chart.
FOMO indicators have done very well over the past two years with the huge rise
in 0DTE options while I have had to make adj to several other indicators.
I want to start showing a separate chart more often. Bearish sentiment
saw a strong Buy at the mid-Dec post-FOMC selloff which was early similar to Oct
2023, while the current less strong Sell may indicate a pause like early 2024
before a larger rally.
Bonds (TNX). Bearish sentiment has started to creep up as rates
hit a high of 4.8% early in the week after stricter tariffs on Russian oil, but
pulled back on some signs of economic weakness and weaker core CPI.
For the INT outlook, the gold miners (HUI) bearish
sentiment is presented in a new format using the data mining software to add
the inverse TNX rate to the ETF ratio.
Update. Bearish sentiment rose even as gold and HUI rallied.
II. Dumb Money/Smart Money Indicators
This is a new hybrid option/ETF Dumb Money/Smart Money Indicator as a INT/LT
term (outlook 2-6 mns) bearish sentiment indicator. The use of ETFs
increases the duration (term).
Update. Bearish sentiment remains at a weak Sell.
With the sister options Hedge Spread as a ST/INT indicator
(outlook 1-3 mns), bearish sentiment fell to about halfway between neutral
and a weak Sell.
A new composite SPX options indicator uses both the volume adj (1/B-A) and P/C
equivalent spread (A-B) to compensate for the discrepancy between the two.
This replaces the old SPX options indicator for the SPX ETFs + options below and the
INT/LT composite. No chart.
For the SPX, I am switching to hybrid 2X ETFs plus SPX options. Taking a look at the
INT term composite (outlook 2 to 4 mns), bearish sentiment remains near
neutral.
For the NDX combining the hybrid ETF options plus NDX 3X ETF sentiment with the interest rate effect,
(outlook 2 to 4 mns) bearish sentiment shows similar extremes between ETF and
options as in late 2020 which resulted in a choppy market until options
sentiment rose. Note QQQ options are optimal, but are N/A and are included
in ETF options.
Bearish sentiment remains at a weak Sell.
For the SPX combining the hybrid ETF options plus SPX 2X ETF (outlook 2 to 4 mns)
produces an indicator where, in this case, ETF options are a proxy for the SPY options.
Bearish sentiment for SPX remains below neutral.
III. Options Open Interest
Using Thur closing OI, remember that further out time frames are more likely
to change over time, and that closing prices are more likely to be effected.
Delta hedging may occur as reinforcement, negative when put support is broken
or positive when call resistance is exceeded. This week I will look
out thru Jan 24 & EOM. A text overlay is used for extreme OI to improve readability,
P/C is not changed. Also, this week includes a look at the OI for GDX, TLT & IBIT.
A new addition is added for OI $ amounts with breakeven pts (BE) where
call & put $ amounts cross. Note multiply OI$ by 100 for shares/contract.
With Fri close at SPX 5997, options OI for Tue (Mon closed for MLK day) is small
with put support at 5900 and call resistance at 6000. Range of 5950-6000
looks likely.
Wed SPX has similar OI where SPX is likely to stay in the mid-5900s.
For Fri SPX shows moderate call resistance in the 5900s and with the straddle at
5950 is likely to trade between 5925-75.
For EOM SPX OI shows that strong put support begins around 5950 and strong call
resistance is at 6020 with a BE of 5980. Range of 5975-6025 is lkely.
Using the GDX as a gold miner proxy closing at 36.75. options OI shows a
tight range is likely between support at 35.5 and resistance at 37.5.
Currently the TLT is 87.2 with the TNX at 4.6%, there is little put support, but
prices are below BE so rates may fall to 4.5% or lower.
Currently the IBIT is 59.6 with the $BTCUSD at 104k, early in the week when BTC
fell to 88 IBIT hit 50.7 then both rallied about 20% into Fri close. O/H
resistance is 60.5 (108k) and strong at 65 (115k), support is 55.5.
IV. Technical / Other
The following uses barcharts.com as a source and discusses S&P futures (ES) as a third
venue of stock sentiment in addition to options and ETFs. The non-commercial/commercial
spread represents a LT bearish sentiment (dumb money/smart money) indicator. As explained in investopedia,
commercial investors (red) are institutions and are smart money, while non-commercials (green) are speculators such as
hedge funds and are dumb money. Here is the current barchart graph
for the S&P 500 (top) and trader positions (1st bot) with positives as net longs and negatives
as net shorts.
Bearish sentiment is represented by the spread and is positive if red > green
(Buy) and negative if green > red (Sell). ES (SPX) sentiment remains
at neutral -0.1 SD, NQ (NDX) bearish sentiment is between a weak and strong Sell at -1.75 SD, YM (DJIA)
remains below neutral at -0.5 SD.
Click dropdown list to select from the following options:
Tech / Other History
2024
2023
2022
Other Indicators
Conclusions. The second most exciting thing that happened during
the week was Fri release of Trumps meme coin which rocketed from $0.18 to over
$30 for 16000% gain. During Trumps first term, I accused him of being
stockbrocker-in-chief due to his monitoring the markets after announcing
possible policy changes and now it appears that he may become the
cryptobroker-in-chief. Why bother working when you can just subscribe to
Truth Social and get rich speculating in crypto?
Weekly Trade Alert. A pullback is likely next week to fill the
nearest gap at SPX 5940, but a move back over 6000 to test the recent highs is
likely by EOM. Updates @mrktsignals.
Since the mid-Dec FOMC, I have been indicating that the Fed was likely to
pause its rate-cutting cycle due to persistent strength in the economy and
"sticky" inflation, so the continued panic over every bit of "good" news has
surprised me. The flip side of a strong economy is strong earnings,
however, which why I did not expect much of a rally until EPS season begins
mid-Jan. Equity markets, however, seem to be focused on the Feds rate
cycle currently, but if you look at the last tech boom into 2000, this coincided
with a pause for 6 mns in the Feds hiking cycle after the LTM crisis, but when
the economy continued its expansion, both stocks and rates rose into Mar 2000.
What appears likely this time is that stocks may stay range bound (5800-6100)
until Trumps "new agenda" with cut backs in spending and tariffs slow the
economy, resulting in lower rates and a stock blowoff right before a recession
and a 20% decline in stock prices.
For the last week, the SPX was expected to bounce around 6000 and Mon got off
to a strong start rising in the AM to about 6020 before a pullback, but on Tue
AM the "good news is bad news" started with strength in both the JOLTS job
opening data and ISM services survey which showed broad strength in the services
sector and the SPX fell to below 5900 by Wed AM. The "good" news selloff
continued Fri when the unemployment data showed 256K new jobs created (about
100k over est) and the unempl rate dropped to 4.1%. As a result the prob
of any Fed rate cuts soon dropped essentially to zero, unless stocks crash.
Sentiment remains muddled with some improvement in the ST indicators (but below
a weak Buy), while INT and LT indicators remain negative. SPX options OI
is showing strong put support below 5800, but a brief dip below would not
surprise. With monthly options exp on Fri fairly strong pu support
indicates a good possibility of seeing SPX 5950 by Fri, and with the FOMC on
27-28, the EOM OI also shows 5950 as a likely target.
I. Sentiment Indicators
The INT/LT Composite indicator (outlook 3 to 6+ months) has three separate
components. Starting Aug 26, 2023 SPX options are removed due to extreme 0DTE volume
distortions. New weights are ETF put-call indicator (30%), SPX 2X ETF INT
ratio (40%), and 3rd a volatility indicator (30%) which combines the options
volatility spread of the ST SPX (VIX) to the ST VIX (VVIX) with the UVXY $ volume.
Update Alt, INT view. Bearish sentiment continues to improve with a move
toward neutral.
Update Alt EMA. Bearish sentiment improved with a move toward neutral.
The ST Composite as a ST (1-4 week) indicator includes the NYSE volume ratio
indicator (NYDNV/NYUPV & NYDNV/NYDEC) and the UVXY $ Vol/[SPX Trend, SMA only]. Weights
are 80%/20%.
Update. Bearish sentiment fell below neutral early in the week, but reversed
with the late week decline.
Update EMA. Bearish sentiment rose slightly, nearing a weak Buy.
Using a ST view, the ST VIX calls and SPXADP indicator bearish sentiment
improved slightly to a weak Buy.
The ST/INT Composite indicator (outlook 1 to 3 months) is based on the Hedge Spread (48%)
and includes ST Composite (12%) and three options FOMO indicators using SPX (12%),
ETF (12%), and Equity (12%) calls compared to the NY ADV/DEC issues (inverted). FOMO
is shown when strong call volume is combined with strong NY ADV/DEC. See
Investment Diary
addition for full discussion.
Update EMA. Bearish sentiment continued to rise from a strong Sell late Dec,
matching the sentiment level of July 2024 before a 10% correction based on
strong option FOMO (call buying). If similarities continue, more
downside is possible.
Bonds (TNX). Bearish sentiment ticked up slightly as the TNX
rose toward 4.8% (for equities 5% becomes major risk).
For the INT outlook, the gold miners (HUI) bearish
sentiment is presented in a new format using the data mining software to add
the inverse TNX rate to the ETF ratio.
Update. Bearish sentiment rose slightly as gold regained the $2700 level.
II. Dumb Money/Smart Money Indicators
This is a new hybrid option/ETF Dumb Money/Smart Money Indicator as a INT/LT
term (outlook 2-6 mns) bearish sentiment indicator. The use of ETFs
increases the duration (term).
Update. Bearish sentiment continues its slow decline but remains well above
the levels of late 2021 prior to the 2022 bear market phase.
With the sister options Hedge Spread as a ST/INT indicator
(outlook 1-3 mns), bearish sentiment rose very slightly and remains below
neutral.
A new composite SPX options indicator uses both the volume adj (1/B-A) and P/C
equivalent spread (A-B) to compensate for the discrepancy between the two.
This replaces the old SPX options indicator for the SPX ETFs + options below and the
INT/LT composite. No chart.
For the SPX, I am switching to hybrid 2X ETFs plus SPX options. Taking a look at the
INT term composite (outlook 2 to 4 mns), bearish sentiment remains just below
neutral.
For the NDX combining the hybrid ETF options plus NDX 3X ETF sentiment with the interest rate effect,
(outlook 2 to 4 mns) bearish sentiment shows similar extremes between ETF and
options as in late 2020 which resulted in a choppy market until options
sentiment rose. Note QQQ options are optimal, but are N/A and are included
in ETF options.
Bearish sentiment remains near a weak Sell.
For the SPX combining the hybrid ETF options plus SPX 2X ETF (outlook 2 to 4 mns)
produces an indicator where, in this case, ETF options are a proxy for the SPY options.
Bearish sentiment for SPX remains below neutral.
III. Options Open Interest
Using Thur closing OI, remember that further out time frames are more likely
to change over time, and that closing prices are more likely to be effected.
Delta hedging may occur as reinforcement, negative when put support is broken
or positive when call resistance is exceeded. This week I will look
out thru Jan 17 & EOM. A text overlay is used for extreme OI to improve readability,
P/C is not changed. A new addition is added for OI $ amounts with breakeven pts (BE) where
call & put $ amounts cross. Note multiply OI$ by 100 for shares/contract.
With Fri close at SPX 5827, options OI for Mon is moderate with strong put
support below 5800 and weak support up 5900. ITM puts could give a
positive bias to 5950+.
Wed has SPX only small OI where SPX has relatively strongly put support between
5800 and 5900 that should continue a positive bias.
For Fri AM SPX has stronger OI with strong put support up to 6000 (overlay not
shown +30k p&c at 6k). Price target 5950-6000.
For Fri PM SPX has moderate OI with a positive bias to 5950.
For Fri EOM, SPX has moderate OI with a positive bias to 5950.
IV. Technical / Other
The following uses barcharts.com as a source and discusses S&P futures (ES) as a third
venue of stock sentiment in addition to options and ETFs. The non-commercial/commercial
spread represents a LT bearish sentiment (dumb money/smart money) indicator. As explained in investopedia,
commercial investors (red) are institutions and are smart money, while non-commercials (green) are speculators such as
hedge funds and are dumb money. Here is the current barchart graph
for the S&P 500 (top) and trader positions (1st bot) with positives as net longs and negatives
as net shorts.
Bearish sentiment is represented by the spread and is positive if red > green
(Buy) and negative if green > red (Sell). ES (SPX) sentiment remains
at neutral 0.0 SD, NQ (NDX) bearish sentiment remains a strong Sell at -2.0 SD, YM (DJIA)
remains near a weak Sell at -0.75 SD.
Click dropdown list to select from the following options:
Tech / Other History
2024
2023
2022
Other Indicators
Conclusions. Probably the biggest surprise so far this year has
been the performance of Germany's DAX index with
the EU economy and Germany in particular facing an economic downturn. While
the SPX is down over 5%, the DAX is only down 1.5% from ATH, but the EU is still
expected to continue cutting rates which bolsters the outlook that int rates may
be "trumping" economic strength. The best analyst I've seen for this year
so far is ExecSpec who is looking for an SPX 10% pullback thru Feb.
Weekly Trade Alert. SPX options OI are indicating a somewhat
limited range of 5800-5950 for next week and EOM. Updates @mrktsignals.