Weekly outcomes continue to be swayed by the seemingly
unpredictable tariff pollicies by DJT. The previous Fri announcement of
aditional tariffs sent foreign markets skidding while US markets were closed.
The expected drop last week to SPX 6200 or below was short circuited by Mon
change in deadline from July 9 to Aug 1 which helped put a stop to the US
markets decline although Mon SPX low was 6201. This does seem to make the
Bradley turn date of Aug 13 possibly more important. However, todays (Sat)
call for 30%+ tariffs on Mexico and Canada looks like a repeat of last week, so
who knows what will happen by Mon. SPX options OI continue to show a
likely weak monthly exp targeting SPX 6150-200 or lower. Sentiment is
mostly unchanged to slightly more bearish ST. The NDX futures (NQ) did
show a moderate decline in bearish sentiment toward a strong Sell.
I. Sentiment Indicators
The INT/LT Composite indicator (outlook 3 to 6+ months) has three separate
components. Starting Aug 26, 2023 SPX options are removed due to extreme 0DTE volume
distortions. New weights are ETF put-call indicator (30%), SPX 2X ETF INT
ratio (40%), and 3rd a volatility indicator (30%) which combines the options
volatility spread of the ST SPX (VIX) to the ST VIX (VVIX) with the UVXY $ volume.
Update Alt, INT view. Bearish sentiment rose from near a weak Sell halfway
to neutral.
Update Alt EMA. Bearish sentiment rose to neutral.
The ST Composite as a ST (1-4 week) indicator includes the NYSE volume ratio
indicator (NYDNV/NYUPV & NYDNV/NYDEC) and the UVXY $ Vol/[SPX Trend, SMA only]. Weights
are 80%/20%.
Update. Bearish sentiment remains positive between neutral and a weak Buy.
Update EMA. Bearish sentiment rose from neutral last week to near a weak Buy.
The ST VIX calls and SPXADP indicator bearish sentiment rose back to a weak
Sell.
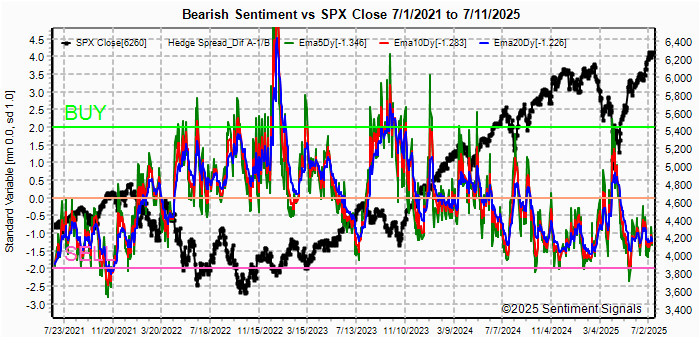
The ST/INT Composite indicator (outlook 1 to 3 months) is based on the Hedge Spread (48%)
and includes ST Composite (12%) and three options FOMO indicators using SPX (12%),
ETF (12%), and Equity (12%) calls compared to the NY ADV/DEC issues (inverted). FOMO
is shown when strong call volume is combined with strong NY ADV/DEC. See
Investment Diary
addition for full discussion.
Update EMA. Bearish sentiment rose but remains at a weak Sell.
Update FOMO calls. Bearish sentiment is relatively unchanged at a weak Sell.
Bonds (TNX). Bearish sentiment remains at low extremes.
For the INT outlook, the gold miners (HUI) bearish
sentiment is presented in a new format using the data mining software to add
the inverse TNX rate to the ETF ratio.
Update. Bearish sentiment fell back to its recent lows from neutral with a
1% gain in HUI last week.
II. Dumb Money/Smart Money Indicators
This is a new hybrid option/ETF Dumb Money/Smart Money Indicator as a INT/LT
term (outlook 2-6 mns) bearish sentiment indicator. The use of ETFs
increases the duration (term).
Update. Bearish sentiment remains at a weak Sell.
With the sister options Hedge Spread as a ST/INT indicator
(outlook 1-3 mns), bearish sentiment remains unchanged at a weak Sell.
A new composite SPX options indicator uses both the volume adj (1/B-A) and P/C
equivalent spread (A-B) to compensate for the discrepancy between the two.
This replaces the old SPX options indicator for the SPX ETFs + options below and the
INT/LT composite. No chart.
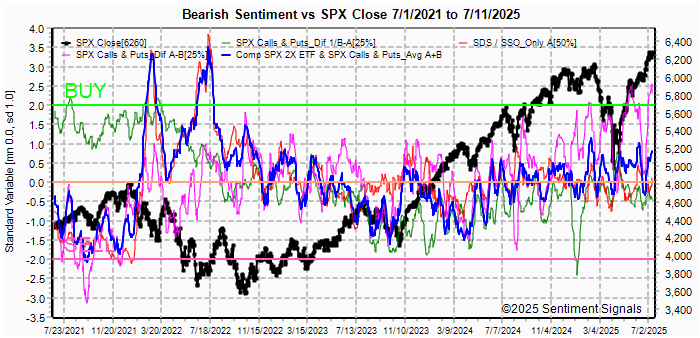
For the SPX, I am switching to hybrid 2X ETFs plus SPX options. Taking a look at the
INT term composite (outlook 2 to 4 mns), bearish sentiment rose slightly
toward a weak Buy.
For the NDX combining the hybrid ETF options plus NDX 3X ETF sentiment with the interest rate effect,
(outlook 2 to 4 mns) bearish sentiment shows similar extremes between ETF and
options as in late 2020 which resulted in a choppy market until options
sentiment rose. Note QQQ options are optimal, but are N/A and are included
in ETF options.
Bearish sentiment remains at a weak Sell.
For the SPX combining the hybrid ETF options plus SPX 2X ETF (outlook 2 to 4 mns)
produces an indicator where, in this case, ETF options are a proxy for the SPY options.
Bearish sentiment for SPX rose slightly, now halfway to neutral.
III. Options Open Interest
Using Thur closing OI, remember that further out time frames are more likely
to change over time, and that closing prices are more likely to be effected.
Delta hedging may occur as reinforcement, negative when put support is broken
or positive when call resistance is exceeded. This week I will look
out thru July 16. A text overlay is used for extreme OI to improve readability,
P/C is not changed. Also, this week includes a look at GDX, TLT & IBIT for Mar exp.
A new addition is added for OI $ amounts with breakeven pts (BE) where
call & put $ amounts cross. Note multiply OI$ by 100 for shares/contract.
With Fri close at SPX 6260, options OI for Mon is small/moderate with P/C
support resistance from 6250-75, then 6225 and 6300.
Wed has smaller OI where SPX has wide support resistance of 6100-300 and will
likely be governed by Fri monthly exp.
For Fri AM strong SPX OI still shows a negative bias toward 6150-6200. The
straddle at 6000 is now so far OTM that it may have little effect.
For Fri PM moderate/strong SPX OI is also negatively biased toward 6200.
IV. Technical / Other
The following uses barcharts.com as a source and discusses S&P futures (ES) as a third
venue of stock sentiment in addition to options and ETFs. The non-commercial/commercial
spread represents a LT bearish sentiment (dumb money/smart money) indicator. As explained in investopedia,
commercial investors (red) are institutions and are smart money, while non-commercials (green) are speculators such as
hedge funds and are dumb money. Here is the current barchart graph
for the S&P 500 (top) and trader positions (1st bot) with positives as net longs and negatives
as net shorts.
Bearish sentiment is represented by the spread and is positive if red > green
(Buy) and negative if green > red (Sell). ES (SPX) bearish
sentiment is slightly positive at 0.5 SD, NQ (NDX) bearish sentiment
increased over weak Sell at
-1.75 SD, YM (DJIA) remains near a weak Sell at -0.5 SD.
Click dropdown list to select from the following options:
Tech / Other History
2025
2024
2023
2022
Other Indicators
Conclusions. This weeks Phil's Stockworld
sums up most of my thoughts on DJTs tariff policy. Although bigger
picture, I think the purpose is to stop the China juggernaut. Much of the
global growth the last 20 years has come from China, and the US seems to be
willing to slow global growth if it slows China more than the US. Next
weeks CPI/PPI may be the last "good" report for a while. I've noticed that
Kroger and Walmart have raised prices on many items 10% or more. It seems
than rather raise items effected by tariffs by 20-30% or more, they are just
raising the price of everything.
Weekly Trade Alert. Still looking for a pullback to SPX 6150-200
next week. Updates @mrktsignals.


No comments:
Post a Comment