Saturday, May 21, 2022

Too Late to be Bearish, but Too Early to be Bullish

Last weeks outlook was a bust as an early week pullback to SPX 3950 was expected to lead to a rally over 4100 for optn exp and instead an early rally to the 4090 saw a sharp reversal following negative results and outlook from Walmart and Target Tue/Wed that pushed the SPX back down to 4000.  Once SPX 4000 gave way the strong put support gave way to option dealers negative delta hedging (selling futures) to cover losses pushing the SPX to 3900 by Thur close and then 3810 late Fri before a late rebound to 3900.

Last weeks selloff did produce several ST/INT buys from a variety of sources.  First, the Demark TA signal gave a ST buy with an SPX target of ~4450 as discussed in Forbes and MW Thur/Fri, but the results since 2000  are not that impressive if you exclude the 2009 and 2011 Fed QE induced effects (unlikely with current tightening).  From a macro perspective, Nomura thinks that the Fed may back off on rate hikes when QT is implemented June-Sept, and D.Tokic started a tactical buy with a target of SPY 450 (about the same as the low SPX 4500s mentioned last week) based on expectations of Biden cancelling the tarriffs on imported goods from China as a means of relieving supply shortages.  I wonder what happened to "supply-side" economics, it always seems to be used by the GOP to prop up corp profits but why not use it to actually incentivize production.

Last FOMC week, I noted a "special" Tues SPXW option OI, but as it turns out that was a trial run by the CBOE to add Tue/Thur SPXW options.  In late 2005, the CBOE starting adding M/W/F options for SPX, but wide usage was delayed until 2010.  Currently, Tue/Thur SPXW options trade with lighter volume and wider bid/ask and will not be included in the options section until usage widens.


I. Sentiment Indicators

The INT/LT Composite indicator (outlook 3 to 6+ months) has three separate components. 1st is the SPX and ETF put-call indicators (30%), 2nd the SPX 2X ETF INT ratio (40%), and 3rd a volatility indicator (30%) which combines the options volatility ratio of the ST SPX (VIX) to the ST VIX (VVIX) with the UVXY $ volume.

Update.  Not much change from last week with overall bearish sentiment just below the Buy level mainly due to the decrease in ETF hedging for SPX in favor of NDX (see below).

The ST Composite as a ST (1-4 week) indicator includes the NYSE volume ratio indicator (NYDNV/NYUPV & NYDNV/NYDEC) and the UVXY $ Vol/SPX Trend. Weights are 80%/20%.

Update.  Extreme buying of UVXY pushed sentiment to a Buy, but previous extremes lead to lower SPX prices on a retest.


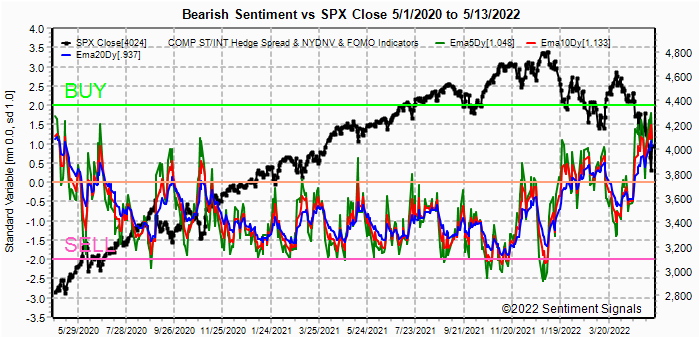
Update EMA.  As mentioned last week, similar Buy spikes in June and Sept 2021 saw a short rally then a lower low (although not called very well), and now the ST Sell mid-week seems to be lining up with Sept-Oct 2021 which was followed by a rally of several months. The ST/INT Composite indicator (outlook 1 to 3 months) is based on the Hedge Spread (48%) and includes ST Composite (12%) and three options FOMO indicators using SPX (12%), ETF (12%), and Equity (12%) calls compared to the NY ADV/DEC issues (inverted). FOMO is shown when strong call volume is combined with strong NY ADV/DEC. See Investment Diary addition for full discussion.

Update LT EMA.  Although significantly higher than the last two years, comparison to the pre-Covid period shows similar sentiment to July-Aug 2018 and not a major bear market bottom.

Bonds (TNX).  Bearish sentiment in bonds surprisingly rose last week even as int rates pulled back from the 3.2% area which supports the expected range trade of 2.75-3.25%. For the INT outlook with LT still negative, the gold miners (HUI) bearish sentiment is presented in a new format using the data mining software to add the inverse TNX rate to the ETF ratio.

Update.  Somewhat similar to bonds, a modest rally off the 240 support area saw a sharp increase in bearish ETF sentiment back to neutral, indicating fairly strong support in that area.


II. Dumb Money/Smart Money Indicators

This is a new hybrid option/ETF Dumb Money/Smart Money Indicator as a INT/LT term (outlook 2-6 mns) bearish sentiment indicator. The use of ETFs increases the duration (term).

Update.  We now have a double top Buy that looks like a fractal of the Oct-Dec 2018 selloff of about 20%.  This is the only INT/LT indicator (not ETFs) that would support a new ATH.

With the sister options Hedge Spread bearish sentiment as a ST/INT indicator (outlook 1-3 mns), bearish sentiment is the highest since Mar 2020 with the current sentiment similar to July-Aug 2018.
Update ST EMA Taking a look at the ETF ratio of the INT term SPX INT (2X) ETFs (outlook 2 to 4 mns) as bearish sentiment, remained mostly unchanged for the week. Using the TNX plus ETF sentiment shown for the HUI as the NDX sentiment with the interest rate effect.  The INT term NDX ST 3x ETFs + TNX (outlook 2 to 4 mns) bearish sentiment using the faster EMAs also shows a huge spike (last week showed NDX ETF only).


III. Options Open Interest

Using Thur closing OI, remember that further out time frames are more likely to change over time, and that closing prices are more likely to be effected. Delta hedging may occur as reinforcement, negative when put support is broken or positive when call resistance is exceeded.  This week I will look out thru May 27 & EOM. A text overlay is used for extreme OI to improve readability, P/C is not changed. Also, this week includes a look at the GDX & TLT for June exp.   A new addition is added for OI $ amounts with breakeven pts (BE) where call & put $ amounts cross and $ volume.

With Fri close at SPX 3901, options OI for Mon is very small but shows strong put support at 3875 and 39003.  A positive bias toward SPX 3950 or higher is expected.
Wed has somewhat larger OI where SPX has smaller OI where put support is weaker and call resistance relatively stronger at 4050 and 4150.  Some weakness is expected.
For Fri strong put support over a wide range should cause a positive bias with call resistance starting at 4050.  SPX 4000-50 is possible.
For EOM stronger put support should continue to support higher prices where 4100+ looks possible.

Using the GDX as a gold miner proxy closing at 32 appears to be in a wide trading range with put support at 30 and call resistance at 35.

Currently the TLT is 118.5 with the TNX at 2.89%, and could stay in a range of 118-120 (TNX 2.75-3%).


IV. Technical / Other - N/A


Conclusions.  Over sold indicators have reached an extreme where stocks may begin to bounce, but macro and fundamentals show little support for more that a 5-6% rally  (SPX 200-300 pts from low) until there is change.  Possible "game changers" that could spur a 10-15% rally include less Fed hawkishness (.25% rate hikes), Biden's elimination of tariffs with China to ease supply pressures, China's dropping covid lockdowns and reopening economy, and conclusion of the Russia/Ukraine conflict.  All together may result in ATH, but unlikely.  Otherwise a trading range 3825-4125 seems likely.

Weekly Trade Alert.  Bearish SPX OI sentiment for Mon should produce higher prices by the close with a reversal by mid-week and strength thru EOW with 4000-50 possible.   With next Mon a holiday, EOM could see 4100+.  Updates @mrktsignals.

Investment Diary,  Indicator Primer, Tech/Other Refs,
 update 2021.07.xx  Data Mining Indicators - Update, Summer 2021,
 update 2020.02.07 Data Mining Indicators,
 update 2019.04.27 Stock Buybacks,
 update 2018.03.28 Dumb Money/Smart Money Indicators

Article Index 2019 by Topic, completed thru EOY 2020.02.04
Article Index 2018 by Topic
Article Index 2017 by Topic
Article Index 2016 by Topic

Long term forecasts

© 2022 SentimentSignals.blogspot.com

Saturday, May 14, 2022

Bears are Likely to Hibernate until the Fall

Last week I was looking for a rally to SPX 4100 before a washout decline to the low 4000s by the Bradley turn date on May 14, but instead news of economic weakness in China pushed prices down directly, bottoming late Thur at 3860 almost an exact 20% decline from the Jan 4820 top.  This was stronger and longer than the Q1 decline of 15-18% forecast in Dec 2021, but is more supportive of what you would expect for an SC4.  So I want to further outline my LT expectations based on what has happened so far.  First there was an excellent article last week outlining the three phases of a bear market and why we were likely close to the end of the liquidity shock phase.

Over the past few weeks, I have mentioned that after the current bear phase I expected a rally into the mid-term elections, roughly following 2018. The primary difference so far is that the May 2018 retest was not a lower low.  This would indicate a modest rally into late June, a pullback, then a melt up into Sept-Oct.  As discussed below, the June EOQ SPX options OI is showing a similar setup to before the Mar rally.  Anyway, given the size of the Jan-May decline of SPX 960 pts, the next bear phase (C wave) is likely to be the panic phase with a 1.62 extension of wave A, and if the rally phase extends to 4500-4550 this would be SPX 3000+/- with the panic coming on a break of the Jan 2020 highs of 3400.  Since 2000 there have been four SPX declines of 20%+ before 2022, with 2000-02 lasting 2.5 years, 2008-09 1.5 years, Oct-Dec 2018 5 months and Mar 2020 5 weeks.  This time I am expecting at least 2.5 years or possibly even 3-5 years before a final bottom.

Although most of the LT bearish sentiment does not indicate a bear market bottom, INT/ST sentiment is equal to or higher than the sentiment seen at the Feb lows that produced an SPX rally from 4120 to 4640.  If this is the end of phase 1 of a bear market, as much as a 70% retracement of the entire decline is normal and indicates a target in the 4530s.  This weeks options OI section includes a look at the EOQ June SPX OI that shows a similar setup to that shown in late Feb. Then a large put position of about 75k puts between 4500-50 were used to project a rally from the low SPX 4100s to 4500+ by the end of Mar and the SPX actually rallied to 4640 before closing EOM at 4550.  This time a slightly smaller amount of June puts are between 4300-50, giving that or higher as a target by EOQ June.


I. Sentiment Indicators

The INT/LT Composite indicator (outlook 3 to 6+ months) has three separate components. 1st is the SPX and ETF put-call indicators (30%), 2nd the SPX 2X ETF INT ratio (40%), and 3rd a volatility indicator (30%) which combines the options volatility ratio of the ST SPX (VIX) to the ST VIX (VVIX) with the UVXY $ volume.

Update.  Sentiment remains near the Buy level but below that of the Feb SPX bottom, mainly due to SPX ETF sentiment, but extreme NDX sentiment may more than offset the difference.  See SM/DM section.

The ST Composite as a ST (1-4 week) indicator includes the NYSE volume ratio indicator (NYDNV/NYUPV & NYDNV/NYDEC) and the UVXY $ Vol/SPX Trend. Weights are 80%/20%.

Update.  Bearish sentiment matched the highest levels of the last two years at last weeks lows.


Update ST EMAs.  Last weeks sentiment remains mostly unchanged with a very ST pullback. The ST/INT Composite indicator (outlook 1 to 3 months) is based on the Hedge Spread (48%) and includes ST Composite (12%) and three options FOMO indicators using SPX (12%), ETF (12%), and Equity (12%) calls compared to the NY ADV/DEC issues (inverted). FOMO is shown when strong call volume is combined with strong NY ADV/DEC. See Investment Diary addition for full discussion.

Update.  From the LT perspective, sentiment remains below levels seen at important bottoms from 2018-20.


Update ST/INT EMAs.  Sentiment is stronger than that seen at the SPX Feb lows a may mean a stronger and/or longer rally than late Mar.

Bonds (TNX).  Bearish sentiment in bonds retreated somewhat.  Since QT will not be started until June at a 50% rate and Sept at 100%, there may continue to be some selling pressure from front-running.  QT light until Sept may coincide with a stock market top. For the INT outlook with LT still negative, the gold miners (HUI) bearish sentiment is presented in a new format using the data mining software to add the inverse TNX rate to the ETF ratio.

Update.  Using the separate indicators, we see that ETF bearish sentiment has started to increase, but remains very weak.


II. Dumb Money/Smart Money Indicators

This is a new hybrid option/ETF Dumb Money/Smart Money Indicator as a INT/LT term (outlook 2-6 mns) bearish sentiment indicator. The use of ETFs increases the duration (term).

Update.  Bearish sentiment has reached the level of Feb 2022, supporting a rally similar to Mar.

With the sister options Hedge Spread bearish sentiment as a ST/INT indicator (outlook 1-3 mns), it remains below the pre-Covid Buy level for an INT/LT bottom.
Update INT, shows a strong increase in hedging relative to the Feb lows. Taking a look at the ETF ratio of the INT term SPX INT (2X) ETFs (outlook 2 to 4 mns) as bearish sentiment, it remains below that seen at the Feb lows. Using the TNX plus ETF sentiment shown for the HUI as the NDX sentiment with the interest rate effect.  The INT term NDX ST 3x ETFs + TNX (outlook 2 to 4 mns) bearish sentiment using the faster EMAs also shows a huge increase in hedging as hedgers seemed to have switched from SPX ETFs to NDX ETFs.  This may concentrate rallies into big cap techs.


III. Options Open Interest

Using Thur closing OI, remember that further out time frames are more likely to change over time, and that closing prices are more likely to be effected. Delta hedging may occur as reinforcement, negative when put support is broken or positive when call resistance is exceeded.  This week I will look out thru May 20. A text overlay is used for extreme OI to improve readability, P/C is not changed.  A new addition is added for OI $ amounts with breakeven pts (BE) where call & put $ amounts cross, and $ volume for EOD Fri.

With Fri close at SPX 4124, a look at Fri options OI showed SPX remains weak relative to sentiment, barely closing over 4000 support level of 4k net puts.
With Fri close at SPX 4124, options OI for Mon is very small and in a strong market a push up to put support at 4150 seems likely, but a weak market is more likely to find support at 3950 with call resistance at 4200.  A decline to 3950 is likely, but a close near 4000 is possible.  
Wed has very small OI where SPX has strong support at 3925 and resistance at 4050.  A slight bias for a range 0f 4000-50, but most likely influenced more by Fri opt exp OI.
For Fri AM strong OI shows a huge dealer net put exposure of $3.5B and with minimal call exposure up to SPX 4150, that would seem to be a minimal target.
For Fri PM moderate OI show a similar picture where the first call resistance level is SPX 4150.  Put support extends up to 4100 then 4175-200 that could push the SPX above 4150.
Similar to late Feb when I called for a "Buy the News" rally into the end of Mar after Russia invaded Ukraine based on high put OI for the EOM Mar, we see a similar setup for the end of June where the SPX is likely to rise to 4300-50.


IV. Technical / Other

This week I just want to look at a couple of volatility indicators, the INT/LT VIX Buy&Sell indicator (SKEW & VIX/VXV) and the ST VIX call indicator.   The VIX Buy&Sell indicator remains well below previous INT lows in Feb and Dec 2018 and Mar 2020, but about the same as the Feb 2022 low, meaning a several hundred pt rally is likely, but only as a pause in a larger bear market.

The VIX call indicator is showing a strong Buy, reversing the strong Sell of early Apr.


Conclusions.  Last week may have been the end of phase 1 of a larger bear market that could last for several years.  Dropping from a peak of SPX peak of 4820 the Thur low at 3860 was similar to the Oct-Dec 2018 decline of 20%, but too many structural problems exist such as supply-chain shortages, a move from off-shoring to on-shoring, and a Fed tightening cycle, to assume that this is more than the beginning of economic problems.  The only solution that could quickly turn things around is a resolution to the Russia/Ukraine  conflict, but that seems unlikely.

Weekly Trade Alert.  Next week could start out with some weakness with a drop to SPX 3950ish, but a rally to SPX 4150 by Fri optn exp close is likely.  Another pullback may occur into the EOM, but a strong rally to 4300-50 is expected by EOM June.  Updates @mrktsignals.

Investment Diary,  Indicator Primer, Tech/Other Refs,
 update 2021.07.xx  Data Mining Indicators - Update, Summer 2021,
 update 2020.02.07 Data Mining Indicators,
 update 2019.04.27 Stock Buybacks,
 update 2018.03.28 Dumb Money/Smart Money Indicators

Article Index 2019 by Topic, completed thru EOY 2020.02.04
Article Index 2018 by Topic
Article Index 2017 by Topic
Article Index 2016 by Topic

Long term forecasts

© 2022 SentimentSignals.blogspot.com

Saturday, May 7, 2022

All Roads Lead to Nowhere

All Roads Lead to Nowhere

Last week the SPX was expected to start with a trading range around 4130 and Mon ended up dropping to 4063 before rallying to 4160s.  Tue options OI was a bust, but Wed saw a strong post-Fed rally to just tag the 4300 target, then gave it all back on Thur.  May 14 Bradley turn is date still looking good for a low.  Next week sees the Apr figures for CPI Wed and PPI Thur and may provide the catalyst of a swing/INT low.

Int rates (TNX/TLT) remain a key driver of SPX ST prices and if you were watching Fri AM an early rise in rates (TNX) by 75 BP (.075%) was followed by a 75 pt drop in the SPX over the next couple of hours, while a decline in rates preceded a PM rally.  The ST/INT outlook for rates is somewhat uncertain, but as shown in the TLT/TBT sentiment chart, with the TNX now at 3.12% it is very near the IHS INT target of 3.25% and that may mean a top in rates for a few months.  Also, an EW perspective of the inflation rally for TNX since Russia invaded Ukraine shows a 5 wave structure from 1.7% with a (+.8%) > c (+.65%) > e (possible +.5%) to 3.25% (supporting IHS target).

This weeks sentiment is showing increasing possibility of both a ST and INT/swing low approaching, but as noted above the durability of any rally is going to depend on the ST trend in int rates.  The most likely outcome seems to be a summer, fall and Xmas rally before a more serious downturn.


I. Sentiment Indicators

The INT/LT Composite indicator (outlook 3 to 6+ months) has three separate components. 1st is the SPX and ETF put-call indicators (30%), 2nd the SPX 2X ETF INT ratio (40%), and 3rd a volatility indicator (30%) which combines the options volatility ratio of the ST SPX (VIX) to the ST VIX (VVIX) with the UVXY $ volume.

Update.  Bearish sentiment continued to rise last week reaching the Buy levels comparable to the pullbacks of late 2020, but less than the level of the Feb 2022 selloff.  A less dramatic, but possibly longer lasting rally is expected than seen in Mar 2022, possibly to the SPX 4700s by the midterm elections.

The ST Composite as a ST (1-4 week) indicator includes the NYSE volume ratio indicator (NYDNV/NYUPV & NYDNV/NYDEC) and the UVXY $ Vol/SPX Trend. Weights are 80%/20%.

Update.  Extreme levels of UVXY $ Vol typically precede a significant bottom, but sometimes occur before a final bottom.


Update.  ST EMAs have now reached a Buy spike last seen in June and Sept of 2021 where a ST bounce of a few days preceded a final low before a significant rally.  Lows may be in by the EOW. The ST/INT Composite indicator (outlook 1 to 3 months) is based on the Hedge Spread (48%) and includes ST Composite (12%) and three options FOMO indicators using SPX (12%), ETF (12%), and Equity (12%) calls compared to the NY ADV/DEC issues (inverted). FOMO is shown when strong call volume is combined with strong NY ADV/DEC. See Investment Diary addition for full discussion.

Update.  LT pre-Covid Fed view shows bearish sentiment similar to late Jan and Feb 2022 bottoms, but not at major bottom levels, so a corrective rally but not a new bull market is expected.


Update ST/INT EMA bearish sentiment is now higher than at the Jan and Feb 2022 lows, indicating that a stronger rally is expected, but the stair-step pattern like the late Feb pattern may mean a period of basing is ahead before a significant rally. Bonds (TNX).  Bearish sentiment in bonds remains in a modestly supportive area, but unlikely supporting a final top in rates.  The IHS target of 3.25% is extremely close and may indicate a consolidation between 2.75% and 3.25% for 4-6 months that would likely see a sizable rally in SPX, but a move higher in rates is likely by EOY. For the INT outlook with LT still negative, the gold miners (HUI) bearish sentiment is presented in a new format using the data mining software to add the inverse TNX rate to the ETF ratio.

Update.  The freefall in HUI seems to have slowed, but sentiment remains at the Sell level and any sign of slowing in inflation could start another sharp decline.


II. Dumb Money/Smart Money Indicators

This is a new hybrid option/ETF Dumb Money/Smart Money Indicator as a INT/LT term (outlook 2-6 mns) bearish sentiment indicator. The use of ETFs increases the duration (term).

Update.  Bearish sentiment is now almost back to the levels of early Mar and may mean a rally back to the SPX 4600s or higher is likely INT.

With the sister options Hedge Spread bearish sentiment as a ST/INT indicator (outlook 1-3 mns), LT pre-Covid Fed view shows that increased hedging is still well below the pre-Covid levels and is unlikely to support a rally to major new highs. Taking a look at the ETF ratio of the INT term SPX INT (2X) ETFs (outlook 2 to 4 mns) as bearish sentiment, sentiment declined slightly during the week, but remains well above the Buy level. Using the TNX plus ETF sentiment shown for the HUI as the NDX sentiment with the interest rate effect.  The INT term NDX ST 3x ETFs + TNX (outlook 2 to 4 mns) bearish sentiment using the faster EMAs also shows a move to the strongest bearish sentiment since Dec 2018.  Combined with the likelihood of int rates (TNX) topping, this means that the NDX may become the leader of the coming rally likely into the Fall.


III. Options Open Interest

Using Thur closing OI, remember that further out time frames are more likely to change over time, and that closing prices are more likely to be effected. Delta hedging may occur as reinforcement, negative when put support is broken or positive when call resistance is exceeded.  This week I will look out thru May 13. A text overlay is used for extreme OI to improve readability, P/C is not changed.  A new addition is added for OI $ amounts with breakeven pts (BE) where call & put $ amounts cross plus $ volume.

With Fri close at SPX 4123, options OI for Mon is modest with strong put support at 4150 and moderate at 4200.  A strong rally to SPX 4200+ is possible.
Wed has small OI where SPX has some out support at 4100 and 4150 and call resistance at 4200 and 4300 with no strong up/down bias.
For Fri strong put support at SPX 4000-200 indicates that any weakness mid-week is likely to be reversed by EOD.


IV. Technical / Other - N/A


Conclusions.  With the coming Bradley turn date next weekend, the SPX could see an important bottom by Fri or early next week.  I am leaning toward a positive start to the week as follow thru to last Fri late turn around and some optimism into Wed/Thur inflation data, however, inflation is likely to disappoint sending SPX back down to the low 4000s into Fri AM and a more durable turn around Fri afternoon if TNX rates hold the 3.25% level.  A move to TNX 3.5% will probably lead to a washout early week after next.

Weekly Trade Alert.  Ideally, I would like to see an early week rally to SPX 4200+ followed by a mid- late week washout to 4040-60 by Fri AM before a sustained rally begins.  Updates @mrktsignals.

Investment Diary,  Indicator Primer, Tech/Other Refs,
 update 2021.07.xx  Data Mining Indicators - Update, Summer 2021,
 update 2020.02.07 Data Mining Indicators,
 update 2019.04.27 Stock Buybacks,
 update 2018.03.28 Dumb Money/Smart Money Indicators

Article Index 2019 by Topic, completed thru EOY 2020.02.04
Article Index 2018 by Topic
Article Index 2017 by Topic
Article Index 2016 by Topic

Long term forecasts

© 2022 SentimentSignals.blogspot.com