Saturday, March 18, 2023

Sentiment Indicating a Positive Spring

For the most part since Dec, I have been sticking to the big picture with the outlook of a beginning of a multi-year bear market (after inflation), trying to avoid the whipsaws seen by many of the bears who switch from calls for a drop to SPX 3000 or lower on every decline and a high of 4300 or higher on every rally.  Last week ended up on being one of my best calls of the year even though prices were relatively calm.  The outlook was for a move to SPX 3925-75 by EOW with a warning of a probable new low first, and Mon began weak with a drop to 3808 before rallying to 3930 with news of the Fed backing SVB depositors.  With Wed options OI showing weak support down to 3825, the SPX then dropped to 3840 with a move up into Thur to meet the 3950+ target for Fri AM exp and a possible drop to 3900 for PM exp. 

Many are now looking at the SVB, Silvergate, and Credit Suisse problems as the beginning of a 2008-09 financial crisis, but from my perspective this is more like the LTCM crisis of 1998, where a highly leveraged hedge fund had to be bailed out by the Fed.  Later this was looked at as giving the green light to more speculation (BTC up 30% Tue) and a primary driver of the dot-com bubble and bust (will we see bubble#2).

The SPX options component for the INT/LT Composite and SPX ETF+options (DM/SM) is adjusted this weeki for the difference between the sentiment shown by high volume and low P/C ratio discussed last week.  Also Tech/Other shows a SPX volume chart reflecting the high volume seen last week as an INT bullish indicator.


I. Sentiment Indicators

The INT/LT Composite indicator (outlook 3 to 6+ months) has three separate components. 1st is the SPX and ETF put-call indicators (40%), 2nd the SPX 2X ETF INT ratio (30%), and 3rd a volatility indicator (30%) which combines the options volatility ratio of the ST SPX (VIX) to the ST VIX (VVIX) with the UVXY $ volume.  This week breaks SPX options into volume adj (1/B-A) and traditional spread (A-B).

Update Alt. In this case the wts for the SPX 2X ETF ratio (SDS/SSO) and SPX puts & calls spread are adj to equal as in the DM/SM section for SPX ETFs.  Last week saw an uptick in bearish sentiment roughly equal to the Dec lows at SPX 3800 before a 400 pt rally.

Update Alt EMA.  ST EMAs (grn) are near the Level of the Dec price lows, but LT (blu) indicate that more backing and filling may be necessary before a sustainable rally. The ST Composite as a ST (1-4 week) indicator includes the NYSE volume ratio indicator (NYDNV/NYUPV & NYDNV/NYDEC) and the UVXY $ Vol/SPX Trend. Weights are 80%/20%.

Update.  Bearish sentiment has now reached the strong Buy level.
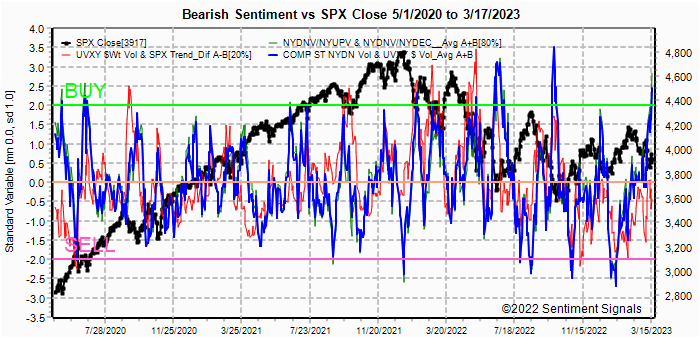

Update EMA.   ST remains weaker than Dec lows, while LT remains weak, indicating backing and filling is probable before a large move up. The VST VIX Call and SPX indicator shows strong SPXADP, but weak VIX call support likely result is choppy advance. The ST/INT Composite indicator (outlook 1 to 3 months) is based on the Hedge Spread (48%) and includes ST Composite (12%) and three options FOMO indicators using SPX (12%), ETF (12%), and Equity (12%) calls compared to the NY ADV/DEC issues (inverted). FOMO is shown when strong call volume is combined with strong NY ADV/DEC. See Investment Diary addition for full discussion.

Update EMA.  Weak Buy level reached.  Bottom is near, but advance likely to be labored.

Bonds (TNX).  Bearish sentiment in bonds remains slightly negative.  Higher rates likely, but it could take a while. For the INT outlook with LT still negative, the gold miners (HUI) bearish sentiment is presented in a new format using the data mining software to add the inverse TNX rate to the ETF ratio.

Update.  Sentiment is near neutral overall, but positive support from ETFS.


II. Dumb Money/Smart Money Indicators

This is a new hybrid option/ETF Dumb Money/Smart Money Indicator as a INT/LT term (outlook 2-6 mns) bearish sentiment indicator. The use of ETFs increases the duration (term).

Update.  A surprisingly strong increase in bearish sentiment ST may indicate an INT strong rally (10%+) if LT sentiment continues to improve.
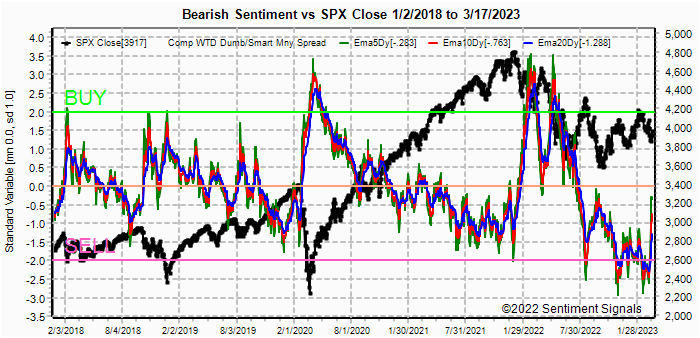
With the sister options Hedge Spread as a ST/INT indicator (outlook 1-3 mns), bearish sentiment reached the Buy level at last weeks lows, but the quick reversal Thur-Fri may mean a choppy advance. A new composite SPX options indicator uses both the volume adj (1/B-A) and P/C equivalent spread (A-B) to compensate for the discrepancy between the two.  This replaces the old SPX options indicator for the SPX + options below and the INT/LT composite.
For the SPX, I am switching to hybrid 2X ETFs plus SPX options. Taking a look at the INT term composite (outlook 2 to 4 mns), bearish sentiment remains weak and may need a few weeks of choppy behavior, similar to Sept 2022, before a sustained advance.

For the NDX combining the hybrid ETF options plus NDX 3X ETF sentiment with the interest rate effect,  (outlook 2 to 4 mns) bearish sentiment shows similar extremes between ETF and options as in late 2020 which resulted in a choppy market until options sentiment rose.  Note QQQ options are optimal, but are N/A and are included in ETF options.

Update.  Last weeks best call was for out-performance by techs with the NDX up 6% vs SPX 1.5% aided by lower rates.  With continued strength in sentiment, relative strength should continue.


III. Options Open Interest

Using Thur closing OI, remember that further out time frames are more likely to change over time, and that closing prices are more likely to be effected. Delta hedging may occur as reinforcement, negative when put support is broken or positive when call resistance is exceeded.  This week I will look out thru Mar 24. A text overlay is used for extreme OI to improve readability, P/C is not changed.   A new addition is added for OI $ amounts with breakeven pts (BE) where call & put $ amounts cross and $ volume.

With Fri close at SPX 3917, options OI for Mon is small with BE only slightly above current levels.  A successful deal for Credit-Suisse could push prices over 3950, otherwise a close between 3925-50 is likely.
Wed has somewhat smaller OI with stronger SPX call resistance at 3950, but BE suggests a  range of 3925-75.
For Fri strong put support up to SPX 3950 may lend a positive bias for the week.  With a BE of 4015, a test of 4000 is likely.

For Fri EOM strong put support does not start until SPX 3900, so lower lows can be seen thru the last week of Mar.  There is also very strong call resistance at 4065, likely from the JPM hedge fund.  The BE at 4000 indicates prices likely to close between 3975-4000.


IV. Technical / Other

Last week saw very strong volume in SPX, just below the 2 SD Buy level and the highest since June of 2020 so a strong rally of 10%+ may be near.  Most of the week was about 50% above ST avg of 2.4B shares while Fri was 5.4B.


Conclusions.  Next week is FOMC Tue-Wed and the price behavior Fri seemed to reflect more hope of a "pivot", but I am going to stick with 2-3 more 25PB hikes based on the strong inflation numbers and the EU 50BP hike.  The markets may be temporarily dissappointed, but options OI indicates a small range of SPX 3925-75 and Fri suggests a move up to the 4000 level from any pullback.   Many of the sentiment indicators are now indicating that there is support building for a strong rally of 10%+ from the SPX 3808 lows or about 4200, but that some bottoming (3900-4000) may be required before more progress.

Weekly Trade Alert.  Not much indication of volatility this week, but a pullback on FOMC Wed toward 3925 may target SPX 4000 Fri.  Updates @mrktsignals.

Investment DiaryIndicator Primer, Tech/Other Refs,
 update 2021.07.xx  Data Mining Indicators - Update, Summer 2021,
 update 2020.02.07 Data Mining Indicators,
 update 2019.04.27 Stock Buybacks,
 update 2018.03.28 Dumb Money/Smart Money Indicators

Article Index 2019 by Topic, completed thru EOY 2020.02.04
Article Index 2018 by Topic
Article Index 2017 by Topic
Article Index 2016 by Topic

Long term forecasts

© 2023 SentimentSignals.blogspot.com

Saturday, March 11, 2023

Are Stocks Destined for Lower for Longer?

Are Stocks Destined for Lower for Longer?

The SPX seemed to be following the prescribed path with weakness thru mid-week to 4000 or lower (3970) before a bounce back to 4025 or higher (Thur AM 4018) before news of a liquidity crisis at Silicon Valley Bank (venture capital) hit the news.  As a bank run and fear of contagion spread, the stock market dropped hard into late Fri, hitting a low at SPX 3848.  Bank stocks as a whole (BKX) were down over 10% for the week  with the collapse of SVB on Fri.  I admit knowledge of the banking sector is a weakness of mine, but I doubt this a sign of widespread contagion similar to the securitized mortgage crisis of 2008-09.  However, Avi has been warning of potential bank liquidity problems for several months, although this may also be enough to cause the Fed to be more cautious with rate hikes.

Several of the longer term indicators, including the INT/LT Composite, Dumb/Smart Money and SPX ETFs and options, remain near recent lows in bearish sentiment so several more weeks of bottoming in the SPX 3750-3850 area are possible before a sustained rally.

Tech/Other takes a closer look at the SPX options put-call spread components that are included in the INT/LT composite, DM/SM indicator and SPX ETF/options indicator, and why it may not be as bearish as it seems.


I. Sentiment Indicators

The INT/LT Composite indicator (outlook 3 to 6+ months) has three separate components. 1st is the SPX and ETF put-call indicators (30%), 2nd the SPX 2X ETF INT ratio (40%), and 3rd a volatility indicator (30%) which combines the options volatility ratio of the ST SPX (VIX) to the ST VIX (VVIX) with the UVXY $ volume.

Update Alt. In this case the wts for the SPX 2X ETF ratio (SDS/SSO) and SPX puts & calls spread are adj to equal as in the DM/SM section for SPX ETFs.  The swiftness of the Thur-Fri decline may not have been long enough to reflect changes in sentiment, but low levels of bearishness are still a cause for concern.

Update Alt EMA.  Bearish sentiment continues to decline, but may need a sharp decline (blowoff) before a final top. The ST Composite as a ST (1-4 week) indicator includes the NYSE volume ratio indicator (NYDNV/NYUPV & NYDNV/NYDEC) and the UVXY $ Vol/SPX Trend. Weights are 80%/20%.

Update.  Bearish sentiment rose on top of a strong surge in UVXY $ Vol, but is likely to move higher before a sustainable low in SPX.


Update EMA.  Very ST there could be a bounce for a few days (op exp wk), but is not likely sustainable.
VIX calls & SPXADP.  Sentiment is neutral after a brief surge Thur. The ST/INT Composite indicator (outlook 1 to 3 months) is based on the Hedge Spread (48%) and includes ST Composite (12%) and three options FOMO indicators using SPX (12%), ETF (12%), and Equity (12%) calls compared to the NY ADV/DEC issues (inverted). FOMO is shown when strong call volume is combined with strong NY ADV/DEC. See Investment Diary addition for full discussion.

Update EMA.  A spike in hedging on Fri may lead to a ST reversal, but sentiment should be higher for a sustainable low.

Bonds (TNX).  Bearish sentiment in bonds remains near the weak Sell level and rates are likely to continue higher when the current crisis passes. For the INT outlook with LT still negative, the gold miners (HUI) bearish sentiment is presented in a new format using the data mining software to add the inverse TNX rate to the ETF ratio.

Update.  Gold stocks remain in a tight range with a small increase in bearish sentiment.


II. Dumb Money/Smart Money Indicators

This is a new hybrid option/ETF Dumb Money/Smart Money Indicator as a INT/LT term (outlook 2-6 mns) bearish sentiment indicator. The use of ETFs increases the duration (term).

Update.  Bearish sentiment remains at the Sell level.

With the sister options Hedge Spread as a ST/INT indicator (outlook 1-3 mns), bearish sentiment spiked very ST (grn) to the Buy level but likelky needs for INT sentiment to catch up before a sustainable bottom for SPX. For the SPX, I am switching to hybrid 2X ETFs plus SPX options. Taking a look at the INT term composite (outlook 2 to 4 mns) as bearish sentiment, options sentiment continues to continue to keep this indicator at the Sell level (see Tec/Other for discussion), while ETF sentiment remains neutral.
For the NDX combining the hybrid ETF options plus NDX 3X ETF sentiment with the interest rate effect,  (outlook 2 to 4 mns) bearish sentiment shows similar extremes between ETF and options as in late 2020 which resulted in a choppy market until options sentiment rose.  Note QQQ options are optimal, but are N/A and are included in ETF options.

The majority of the hedging remains to be seen in techs and are therefore expected to outperform SPX.


III. Options Open Interest

Using Thur closing OI, remember that further out time frames are more likely to change over time, and that closing prices are more likely to be effected. Delta hedging may occur as reinforcement, negative when put support is broken or positive when call resistance is exceeded.  This week I will look out thru Mar 17. A text overlay is used for extreme OI to improve readability, P/C is not changed.   A new addition is added for OI $ amounts with breakeven pts (BE) where call & put $ amounts cross.

With Fri close at SPX 3862, options OI for Mon is moderate where delta hedging may offset put support.  Expect range 3850-3900.
Wed has smaller OI where SPX has only modest put support over 3825 with a wide possible range.
For Fri AM strong OI $ in puts is likely to push prices to SPX 3950+.

For Fri PM strong put support extends up to SPX 3900 with a likely range of 3900-4000.
For Fri EOM strong call resistance in the SPX 4025-75 area is likely to limit any upside, and 3950-4000 seems likely.


IV. Technical / Other

This week I wanted to take a closer look at the SPX options.  In late 2019 and 2020 we saw a spike in volume of SPX options before the market top and we are seeing an even larger one in 2023 as reflected in the SPX options spread.  One thing that is different is the P/C ratio.  The 2020 and 2022 tops saw the P/C ratio rise to 1.75+ before a top and todays ratio of 1.25 is more indicative of the early stages of a rally as in the second half of 2020, hence the preference for a trading range with a blowoff top before a large decline (20%+).


Conclusions.   The SVB collapse was unexpected and may have accelerated the decline to SPX 3800 expected by May/June.  The potential change in sentiment is not likely reflected in sentiment measures due to the rapidity of the decline, but my overall outlook for a trading range INT remains unchanged,

Weekly Trade Alert.  There is likely to be a bounce to SPX 3925-75 for opt exp week, but it could be volatile with lower lows first.  Updates @mrktsignals.

Investment DiaryIndicator Primer, Tech/Other Refs,
 update 2021.07.xx  Data Mining Indicators - Update, Summer 2021,
 update 2020.02.07 Data Mining Indicators,
 update 2019.04.27 Stock Buybacks,
 update 2018.03.28 Dumb Money/Smart Money Indicators

Article Index 2019 by Topic, completed thru EOY 2020.02.04
Article Index 2018 by Topic
Article Index 2017 by Topic
Article Index 2016 by Topic

Long term forecasts

© 2023 SentimentSignals.blogspot.com

Saturday, March 4, 2023

March Madness May Have Begun Early This Year

Last weeks outlook was for a mild advance in SPX.of about 50 to 75 pts from the 3970 level based on strong put option support for Mon & Fri with an uncertain Wed.  Mon started with a gap & go rally of 48 pts with a decline in int rates (TNX), but later in the day receded as rates began to rally.  Rates really took off on Tue & Wed with stronger US econ data and higher EU inflation with the TNX rising to almost 4.1% and the SPX began to fall sharply hitting 3928 early Thur.  The last time rates were this high was early Nov when the SPX was at 3900 which had prompted my outlook for SPX 3900 at TNX 4%+ by mid Mar and SPX 3800 with TNX 4.5% May-Jun, but rates were rising much faster than expected.  By Thur noon the SPX was diverging from bonds rising to 3950+ as rates stayed the same, then about two hours before the close Fed head Bostic indicated the Fed is likely to stick to 25BP (0.25%) hikes and stocks took off with the SPX closing at 3995.  The rally continued all day Fri to the high of the weekly target of SPX 50-75 pts from 3970 at 4047, and the middle of the SPX OI target of 4025-75.

It's possible this was just a strong short-covering rally of those short looking for the SPX 3800 by Mar 8 predicted by BofAs M.Harnett mentioned last week.  One thing I agree with Harnett about is that "war is inflationary", only my comparison is Vietnam rather than WW2 (more in conclusion).  Some of the prominent EW analysts including Avi and Pretzel Logic see this as the beginning of a diagonal to SPX 4300 by Apr, but sentiment as shown below continues to show lack of sufficient bearish sentiment to support a strong rally (10%+).  A few have joined my ranks looking for an extended trading range, including iSPYETF and Exec Spec, while one, Ed Yardeni is looking for SPX 4800 by YE 2023 based on the Jan effect and a strong economy.

In the Tech/Other section this week I look at the LT charts for the 10/20 year bond yield curve and NYSE Adv/Dec vol which both seem consistent with the 1967-70 analog with continued higher rates but no recession until 2025.


I. Sentiment Indicators

The INT/LT Composite indicator (outlook 3 to 6+ months) has three separate components. 1st is the SPX and ETF put-call indicators (30%), 2nd the SPX 2X ETF INT ratio (40%), and 3rd a volatility indicator (30%) which combines the options volatility ratio of the ST SPX (VIX) to the ST VIX (VVIX) with the UVXY $ volume.

Update Alt. In this case the wts for the SPX 2X ETF ratio (SDS/SSO) and SPX puts & calls spread are adj to equal as in the DM/SM section for SPX ETFs.  SPX ETF sentiment continues to decline, while volatility sentiment rose modestly.  Little change in options sentiment leaves overall sentiment very close to a Sell and no support for a rally.

Update Alt EMA.  ST EMAs remain on a Sell. The ST Composite as a ST (1-4 week) indicator includes the NYSE volume ratio indicator (NYDNV/NYUPV & NYDNV/NYDEC) and the UVXY $ Vol/SPX Trend. Weights are 80%/20%.

Update.  Declining volatility sentiment is offset by increasing volume sentiment for a slightly positive composite.


Update EMA.  A spike in vey ST sentiment at the Wed lows has reversed back to neutral. The ST/INT Composite indicator (outlook 1 to 3 months) is based on the Hedge Spread (48%) and includes ST Composite (12%) and three options FOMO indicators using SPX (12%), ETF (12%), and Equity (12%) calls compared to the NY ADV/DEC issues (inverted). FOMO is shown when strong call volume is combined with strong NY ADV/DEC. See Investment Diary addition for full discussion.

Update EMA.  Similar to the above, sentiment only spiked briefly last week and has reversed to slightly negative.

CITI Surprise Inflation Index for Mar shows a broad increase in inflation for the West, esp EU, while China's deflation is spreading (possibly due to offshoring with risk of US conflict over Taiwean?).  This may encourage more CB stimulus from China, however.

Bonds (TNX).  Bearish sentiment in bonds the turmoil in bonds last week had little effect on sentiment with ST EMAs nearing a weak Sell at -1 SD.  Higher rates are likely.

For the INT outlook with LT still negative, the gold miners (HUI) bearish sentiment is presented in a new format using the data mining software to add the inverse TNX rate to the ETF ratio.

Update.  ETF sentiment remains modestly positive, while overall sentiment remains slightly negative.


II. Dumb Money/Smart Money Indicators

This is a new hybrid option/ETF Dumb Money/Smart Money Indicator as a INT/LT term (outlook 2-6 mns) bearish sentiment indicator. The use of ETFs increases the duration (term).

Update.  Very little improvement here as dumb money continues to chase stocks.

With the sister options Hedge Spread as a ST/INT indicator (outlook 1-3 mns), bearish sentiment shows a modest pickup, mostly in techs shown below, that may lead to modestly higher prices before a downturn. For the SPX, I am switching to hybrid 2X ETFs plus SPX options. Taking a look at the INT term composite (outlook 2 to 4 mns),  bearish sentiment has reached the levels of the Dec highs before a drop from 4100 to 3750 and is  likely to limit any upside.
For the NDX combining the hybrid ETF options plus NDX 3X ETF sentiment with the interest rate effect,  (outlook 2 to 4 mns) bearish sentiment shows similar extremes between ETF and options as in late 2020 which resulted in a choppy market until options sentiment rose.  Note QQQ options are optimal, but are N/A and are included in ETF options.

NDX continues to be the favorite hedge/short and should continue relative strength relative to SPX on rallies, but remains vulnerable to higher rates.


III. Options Open Interest

Using Thur closing OI, remember that further out time frames are more likely to change over time, and that closing prices are more likely to be effected. Delta hedging may occur as reinforcement, negative when put support is broken or positive when call resistance is exceeded.  This week I will look out thru Mar 10. A text overlay is used for extreme OI to improve readability, P/C is not changed. Also, this week includes a look at the GDX for Dec exp.   A new addition is added for OI $ amounts with breakeven pts (BE) where call & put $ amounts cross.

With Fri close at SPX 4047, options OI for Mon is moderate with strong put support below 4000, but $OI call resistance is likely to push prices toward 4000.  Target range 4000-25.
Wed has smaller OI where SPX has a similar bias toward 4000 or a little lower.
For Fri stronger OI has put support starting at 3950 and call resistance at 4100 with 4000-50 mostly straddled.  Target near BE at 4025, range 4000-50.


IV. Technical / Other

This week I wanted to take a look at the LT history of the INT/LT US T-bonds (10/20yr) which as pointed out before indicates that over the past 35 years of rate cycles has averaged 0.98-.99 at rate cycle peaks and still has a ways to go.  I am assuming this means that LT inflation epectations are under control at that level.  Note that "alternation" suggests that this time will be a rounded top, ie, higher for longer (two years) before a pivot and a recession in 2025.

The LT NYSE adv/dec volume has apparently topped, but that compared to mid-2020 an SPX top may be 1-2 yrs away.  This is probably a coincidence, but the SPX topped at the same level as the NYSE adv/dec vol for 2012.

Looking at the INT, 5 year chart, the SPX topped at the same level as the mid-2020 vol data.  Is the recent top an indication that there will be a retest of the ATH?


Conclusions.  After looking at the increase in the recent EU inflation data, I found that the largest increase was in food, particularly vegetables, grains, and beef.  As discussed in this article, Ukraine has become as the "breadbasket of Europe" and that much of the shortages of food are due to sharply declining exports from that region.  This has made me rethink the dynamics of the Ukraine-Russian war, as previously I had been in the camp of Martin Armstrong since geographically Ukraine seems of little import.  However, as the above article shows the most fertile and productive land is in the south-east, the exact land that Russia is laying claim to.  The strategic importance then becomes clear, if Russia controls south-east Ukraine, this will give them a strangle-hold on Europe as they will control the food supply as well as a current major supply of energy.  If this is true then the military commitment of the US and EU could be commiserate with the Vietnam war from 1965-75 with similar inflationary consequences.

Back to the markets, the possibility of a decline into mid-Mar before a "surprise" FOMC 25BP rate hike on Mar 22 has been turned upside down with last weeks news release.  Since the SPX proved somewhat stronger at the lows of 3928 vs 3900 target, the potential upside may stretch higher to 4125-50, but I maintain the same general range as a target (3925-4125) thru mid-Apr before a decline to lower lows.

Weekly Trade Alert.  SPX options OI is showing fairly strong resistance from 4050-4100 with a possible drop to 4000 mid-week before a move up to 4025-50 Fri.  Updates @mrktsignals.

Investment DiaryIndicator Primer, Tech/Other Refs,
 update 2021.07.xx  Data Mining Indicators - Update, Summer 2021,
 update 2020.02.07 Data Mining Indicators,
 update 2019.04.27 Stock Buybacks,
 update 2018.03.28 Dumb Money/Smart Money Indicators

Article Index 2019 by Topic, completed thru EOY 2020.02.04
Article Index 2018 by Topic
Article Index 2017 by Topic
Article Index 2016 by Topic

Long term forecasts

© 2023 SentimentSignals.blogspot.com