Saturday, September 1, 2018

Remember September

August was quite a memorable month as the SPX regained the highs lost in January on the lowest volume of the year.  You could say that this was climbing the "wall of worry" as the last few months press has been dominated by talks of Presidential impeachment resulting from involvement in Russian meddling in US elections, trade wars and sanctions on foreign governments that do not toe the line to US policies, and a President that quite frankly acts like a schoolyard bully.  September should see volume returning to the markets and seems on a collision course to repeat the late 2014 volatility pickup.  One sequence of events that could lead to a similar outcome is a mid-Sept high volume top on the SPX, followed by an unfavorable Mueller investigation report in Oct implicating Trump and a sharp selloff, but a GOP victory in the Nov elections would make impeachment unlikely with possible new market highs by EOY.

I. Sentiment Indicators

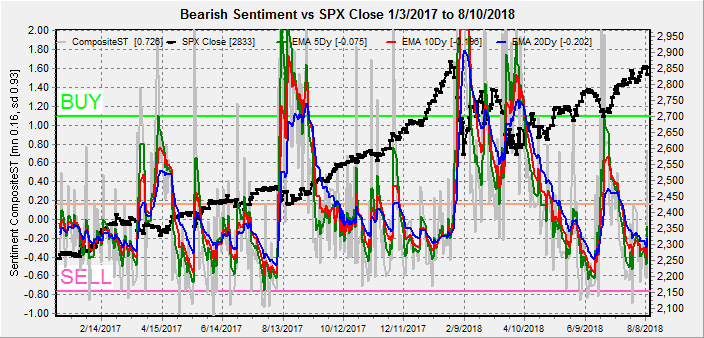
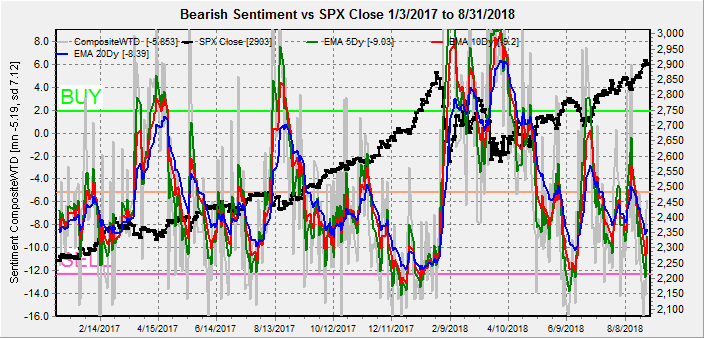
The overall Indicator Scoreboard (INT term, outlook two to four months) saw a sharp plunge in bearish sentiment early last week, but still above the levels seen before the Jan and June tops.  More upside is likely.

The INT view of the Short Term Indicator (VXX $ volume and Smart Beta P/C, outlook two to four months) appears to be in a bottoming process that may not go much lower.  Inconclusive.


Bond bearish sentiment (TNX) has been on the rise recently and I still think that the big surprise may be the TNX and Fed funds rates meeting at 2.5% if the economy slows.  Recent strength in the GDP may be a result of "front running" higher tariff prices by foreign buyers.


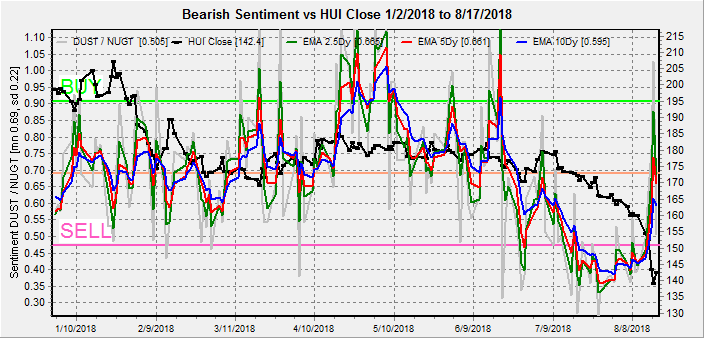
For the INT outlook with LT still negative, the gold miners (HUI) bearish sentiment has continued to rise and is likely to support prices for now.


Taking an infrequent look at the small cap RUT INT sentiment using TZA/TNA, bearish sentiment remains low, but not extremely so.  Limited gains likely.


II. Dumb Money/Smart Money Indicators

The Risk Aversion/Risk Preference Indicator (SPX 2x ETF sentiment/NDX ETF sentiment, outlook 2 to 4 days/hours) as a very ST indicator remains near the bottom of its TL, ahow optimism for techs vs the broad market is high.


The option-based Dumb Money/Smart Money Indicator as short/INT term (outlook 2 to 4 days/weeks) gave a weak SELL mid-week, but the 1% pullback Thur/Fri may be it.  The pattern the last two weeks still resembles that leading to the Jan top with choppy downward action.
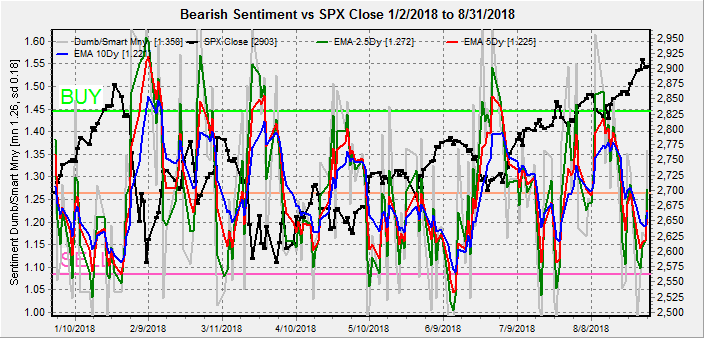

The INT term SPX Long Term/Short Term ETFs (outlook two to four weeks) bearish sentiment has been driven lower by strong buying by the dumb money (2x) ETFs, but both indicator and ETFs are still a few weeks from the Jan extremes.


Long term neutral, the INT term NDX Long Term/Short Term ETF Indicator (outlook two to four weeks) remains the difficult to interpret as three upward trends in sentiment occurred since early 2017 with the first two marking tops at the current levels..


III. Options Open Interest / Other

Using Thurs close, remember that further out time frames are more likely to change over time.  This week I will look out thru Sept 7.

Last Fri showed a pickup in put support at SPX 2880 making a larger drop unlikely, while the close at 2900+ showed relative strength.


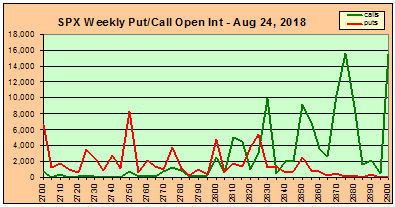
With Fri close at SPX 2902, Tue has very light resistance up to 2925 if the market rallies, while under 2900 the next support level is at 2895.  A weak open is likely to rally.  Light open int overall.


Wed shows strong call resistance at SPX 2925 with some put support up to 2915.
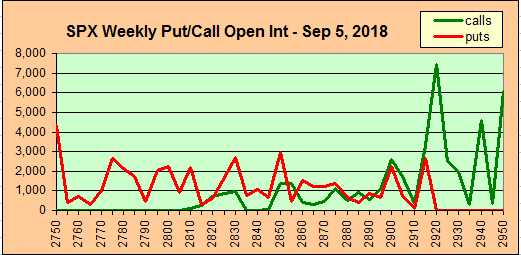

Fri, a jobs report day,  shows larger open int with very strong call resistance from SPX 2925-35 and a positive week is likely going to be capped in that area.  There is little put support to 2850, so there is a small probability of a large decline.


Conclusions.  If the SPX continues to follow the 2014 analog Sept should be up week 1 to about 2925, down week 2 to about 2885, then up week 3 (opt exp) to 2935.  Checking the historical data, mid-Sep 2014 saw a large pickup in VIX call volume near the top, so a similar pickup in volume this year would be a warning.  Otherwise, there is still a possibility that the rally may continue until Nov when a possible blowup of the China trade talks and/or election loss by the GOP could derail the Trump agenda.
 
Weekly Trade Alert.  Next week looks to be up with a target of SPX 2920-30 by Fri.   Updates @mrktsignals.

Investment DiaryIndicator Primer,  update 2018.03.28  Dumb Money/Smart Money Indicators
Article Index 2018 by Topic
Article Index 2017 by Topic
Article Index 2016 by Topic
Long term forecasts

© 2018 SentimentSignals.blogspot.com

Saturday, August 25, 2018

The Longest Bull Market

A couple of weeks ago I pointed out that an important date for Wall St would be Aug 22 in order to claim that US stocks were in the "longest bull market in history", eclipsing the 1991-2000 run (although some argue 1987-2000 is more appropriate).  Fait accompli, as Fri the SPX closed at new highs, but NDX and DJIA did not.  Now FOMO can go into high gear.  Sentiment overall shows low, but not excessively low, bearish sentiment and still reminds me of Jan 2018.  I would not be surprised to see a run up to the SPX mid-2900s into the Sept opt exp as most of the current rally has been on very light volume and the FOMO crowd could enter on higher volume in Sept, much like 2014.  The Humble Student first gave SPX 2925-60 as a "cup and handle" target on July 29, but has recently turned more bearish.

I. Sentiment Indicators

The overall Indicator Scoreboard (INT term, outlook two to four months) has moved back to its recent lows, indicating that the current move may be close to taking a breather.  OntheMoneyUK last week discussed a DeMark setup that implies a run up to SPX 2880-90 before a 40-50 pt pullback.


The INT view of the Short Term Indicator (VXX $ volume and Smart Beta P/C, outlook two to four months) is in a similar pattern but slightly more bullish for prices short term.


Bond sentiment (TNX) surprisingly shows increased bearishness, probably due to expected Fed rate hikes, but a slow down in the economy could push the TNX to 2.5% even if the Fed fund rate rises to 2.5%.


For the INT outlook with LT still negative, the gold miners (HUI) bearish sentiment finally pulled back to the neutral level following the near 40 pt waterfall decline in the HUI over the last month.  We may see a consolidation for several weeks, but I still expect to see downward pressure to the 100 level by year's end.


II. Dumb Money/Smart Money Indicators

The Risk Aversion/Risk Preference Indicator (SPX 2x ETF sentiment/NDX ETF sentiment, outlook 2 to 4 days/hours) as a very ST indicator remains near the bottom of its TL.


The option-based Dumb Money/Smart Money Indicator as short/INT term (outlook 2 to 4 days/weeks) had dropped to a weak SELL early in the week, but closed the week at neutral.


The INT term SPX Long Term/Short Term ETFs (outlook two to four weeks) bearish sentiment dropped significantly last week nearing a SELL that should see at least a weak pullback.


Long term neutral, the INT term NDX Long Term/Short Term ETF Indicator (outlook two to four weeks) pulled back from its recent highs, so the NDX may falter near the 7,500 level.


III. Options Open Interest / Other

Using Thurs close, remember that further out time frames are more likely to change over time.  This week I will look out thru Sept 7.

With Fri close at SPX 2775, Mon has very light resistance up to 2900 if the market rallies, while under 2775 the next support level is at 2850.  Light open int overall.


Wed is somewhat similar except that strong resistance appears at SPX 2900. a push up to the 2890+ area seems likely by Wed.


Fri shows larger open int with significant call resistance starting at SPX 2870, and the 2850 and below show a lot of overlap.  A move down to at least 2850 seems likely


For the following Fri, a jobs report day, the outlook is somewhat like the previous Fri, with support at SPX 2850 and high resistance starting at 2900.  Some consolidation between 2850-2900 is expected.


I haven't looked at the VIX Call Indicator much since Jan, mainly due to very low reading, but recently volume has been picking up.  Early Aug saw a drop to a new low at -48% 10 DMA/Avg and has recently moved over 0%.  The last time we saw a reading this low and a move to 0% was Jan 2017.  We then saw a small pullback, followed by a strong rally in Feb that moved the VIX Call Indicator to +50% before a two month correction.


Conclusions.  Having made a new high in the SPX, some follow thru is to be expected over the next 2-3 days, but a 1-2% pullback is likely thereafter.  A weak volume rally in Aug looks a lot like the setup in 2014 which saw a higher volume continuation in Sept thru opt exp, but a nasty Oct surprise.
 
Weekly Trade Alert.  A move up to SPX 2890+ seems likely by Wed, but a pullback to 2850 into early Sept is indicated by the options open int.   Updates @mrktsignals.

Investment DiaryIndicator Primer,  update 2018.03.28  Dumb Money/Smart Money Indicators
Article Index 2018 by Topic
Article Index 2017 by Topic
Article Index 2016 by Topic
Long term forecasts

© 2018 SentimentSignals.blogspot.com

Saturday, August 18, 2018

Siren's Song

Last week did in fact mirror the price action of two weeks prior, including a breakdown from the current range, a "bear trap", before a sharp reversal. Divergences in sentiment are beginning to appear that point to trouble ahead longer term. I have been pointing out that the Risk Aversion Indicator (SPX/NDX ETFs) remaining at a low level indicated too much relative Dumb Money bullishness for the NDX and would probably lead to underperformance which was seen last week.

The slack, however, was picked up by the DJIA with news of resumption of trade talks with China. It is interesting that the DJIA is the most widely followed index by the public and overseas investors and a new recovery high over 25.8k would probably be considered an "all clear", but with the previous leaders faltering (NDX), this is likely to be a Siren's Song. In Greek mythology, a siren was a mermaid whose calls were used to lure sailors into shipwrecks. The target for a DJIA high could be the gap fill at 26.5k.

I. Sentiment Indicators

The overall Indicator Scoreboard (INT term, outlook two to four months) moved higher with the short term EMAs moving to half way between the SPX May and June lows and the LT EMAs equal to the May lows.  Likely result an SPX 70-100 pt rally.


The INT view of the Short Term Indicator (VXX $ volume and Smart Beta P/C, outlook two to four months) saw an increase in bearish sentiment, but much less than the June lows.  Likely result combined with the Indicator Scoreboard is a two to four week rally, but less dynamic that the last two.


Bond sentiment (TNX) remained near the mean last week with little directional bias.


This week I am going to something a little different with the gold miners (HUI) sentiment.  Many of the gold bugs are now saying that now is the time to buy (same as all year).  They may be right for the very short term, as a spike in bearish sentiment has reached the level of several 10-15 pt rallies (5-10%) in the HUI over 2018.


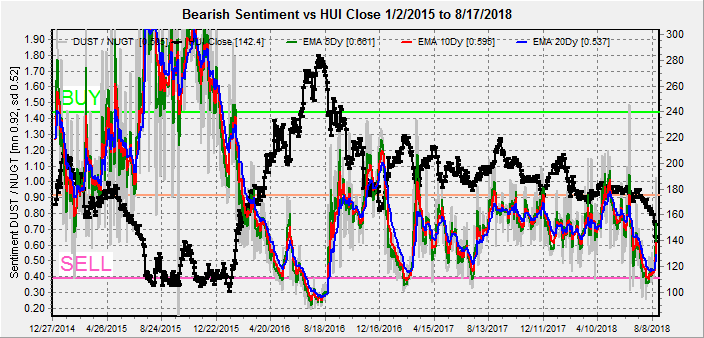
However, LT back to 2015, bearish sentiment remains extremely low.  I fully expect to see a selling climax by the end of the year retesting the 2015 lows, if not lower.  If so a basing period extending into mid-2019, similar to late 2015, is likely before an inflation rally into the 2020 elections.


II. Dumb Money/Smart Money Indicators

The Risk Aversion/Risk Preference Indicator (SPX 2x ETF sentiment/NDX ETF sentiment, outlook 2 to 4 days/hours) as a very ST indicator remains near the bottom of its TL.  As I've pointed out the past couple weeks that this would likely lead to underperformance of the NDX (shown below) to SPX due to higher relative buying by the NDX Dumb Money ETFs.  Last week saw the NDX down about 2% with the SPX down 0.5%, and without Buffett's continuous buying of AAPL, the NDX would be down more.


The option-based Dumb Money/Smart Money Indicator as short/INT term (outlook 2 to 4 days/weeks) reached the BUY level a few days early, but remains at relatively high levels, supportive of higher prices.


This week, I am going to look at a ST view of the INT term SPX Long Term/Short Term ETFs (outlook two to four weeks) bearish sentiment .  Notably there was almost no reaction by the SPX ETF investors to the pullback that started a week and a half ago, as most of the bearish sentiment was generated by ST speculators using put options and VIX products, while the public (ETFs) remained complacent.  This tells me that a bigger correction is on its way after bearish sentiment clears.  Looking at the chart below, there have been four SELLs in 2018, starting in Jan, interestingly they have alternated between strong and weak selloffs with the last in July being weak, so the next SELL is likely to be 100+ SPX pts.  The SPX 200 SMA should be 2750 by the end of Sept, so that may be the target.


Long term neutral, the INT term NDX Long Term/Short Term ETF Indicator (outlook two to four weeks) has moved nearer to the top of its recent range, so some improvement in the NDX performance is expected.


III. Options Open Interest

Using Thurs close, remember that further out time frames are more likely to change over time.  This week I will look out thru Aug 31.

Mon shows moderate call resistance at SPX 2850 and 2870 with put support starting at 2830.  A pullback is possible to 2840-45.  Open int is relatively light.


Wed the 22nd is interesting since this marks "the longest bull market in history".  The setup is the most bullish I've seen in ages with relatively strong put support at 2820, but weak call resistance all the way to 2900.  If the SPX makes it over 2855, then 2875-80 should be easy.


Fri shows huge call positions at SPX 2865 and 2875, with little put support until 2800.  A move to test the ATH Wed is likely to result in a "pop & drop" down to 2850 or possibly 2830 by Fri.


For Fri Aug 31, has large open int and shows strong resistance at SPX 2850 area, with strong support at 2775.  SPX 2800 and 2825 may be critical areas but overlapping puts/calls leave little directional bias.


Conclusions.  Last week went as well as could be expected with Wed drop a little stronger than expected.  The next several weeks may be the setup for a H&S top with next weeks SPX open int showing the possibility of an ATH retest, and the next several weeks showing 2800-50 a likely range.  With the deadline for China trade talk resolution put off to Nov, Sept-Oct may result in a 100+ pt SPX pullback to 2700-50 due to combined negative influence from a Sept Fed rate hike and weaker Oct EPS due to the stronger dollar.  If a larger pullback is seen, then a year-end rally to test SPX 3000 may result depending on trade talks, election results, and future tax cuts.
 
Weekly Trade Alert.  With the SPX closing near 2850, a range of about 2825-75 is expected next week with an ATH retest possible on Wed before a small pullback.   Updates @mrktsignals.

Investment DiaryIndicator Primer,  update 2018.03.28  Dumb Money/Smart Money Indicators
Article Index 2018 by Topic
Article Index 2017 by Topic
Article Index 2016 by Topic
Long term forecasts

© 2018 SentimentSignals.blogspot.com

Saturday, August 11, 2018

What's the Consensus?

A couple of weeks ago I was expecting a pullback that seemed to be indicated by sentiment which was also the consensus opinion and the exact opposite happened.  Since then, I vowed to look at the consensus first, since sentiment seems to have the strongest effect when the consensus expects the opposite.  Next week the consensus is for a larger pullback to about SPX 2790, while sentiment is beginning to point to higher prices before an even larger pullback.

Friday's pullback was no surprise since the SPX options open int has shown for two weeks the potential for a pullback to 2800 due to weak put support and it was a sign of strength that the low was 2826.  There is a good chance that the next two to three days will see some volatility between SPX 2820-50 similar to what we saw between 2800-30 a couple of weeks ago before a 70 pt rally.  There is a good chance that Wall St will want to make a new high around Aug 22 since that would make this stock market the longest bull market in history.

I. Sentiment Indicators

The overall Indicator Scoreboard (INT term, outlook two to four months) moved higher back to neutral, but a few more days of volatility are likely for the longer EMAs to reach the level of two weeks ago before the bounce from SPX 2800.


The INT view of the Short Term Indicator (VXX $ volume and Smart Beta P/C, outlook two to four months) saw a small upward blip Fri. but continues to follow the overall pattern seen in Dec 2017 - Jan 2018.


Bond sentiment (TNX) pulled back up to the mean last week, especially on Fri, as domestic traders were net sellers while demand from overseas with additional Trump sanctions on Turkey pushed the dollar higher and bond rates lower.


For the INT outlook with LT still negative, the gold miners (HUI) bearish sentiment leveled out last week even as prices moved lower.  The stubborn bullishness of the gold bugs is probably due to turmoil from the trade/sanctions of Trump, but "don't fight the Fed" is probably more important in a tightening cycle.


II. Dumb Money/Smart Money Indicators

The Risk Aversion/Risk Preference Indicator (SPX 2x ETF sentiment/NDX ETF sentiment, outlook 2 to 4 days/hours) as a very ST indicator remains near the bottom of its TL.  As I've pointed out that this would likely lead to underperformance of the NDX to SPX, the last cycle saw a lower higher for the NDX even as the SPX made a new recovery high and does not bode well for the longer term.


The option-based Dumb Money/Smart Money Indicator as short/INT term (outlook 2 to 4 days/weeks) again is approaching the BUY level with the Fri decline, but since the last bottom was neutral 2-3 days more of volatility are likely to trigger a BUY.  A SPX 2850 to 2820 whipsaw range is likely.


The INT term SPX Long Term/Short Term ETFs (outlook two to four weeks) bearish sentiment has been hovering near neutral for several weeks now and a sustained move either way is unlikely.


Long term neutral, the INT term NDX Long Term/Short Term ETF Indicator (outlook two to four weeks) has also been in a tight range for several weeks.


III. Options Open Interest

Using Thurs close, remember that further out time frames are more likely to change over time, plus last Fri high P/C ratios implies stronger put support than currently shown.  This week I will look out thru Aug 24.

Mon shows that over SPX 2830 put support is likely to push prices up to 2845 with call resistance starting at 2850.  Open int is relatively light.


Wed shows somewhat stronger put support with pretty much the same price range as Mon.  This does not rule out an up Mon/down Tue/ back up Wed sequence.


Fri AM for monthly exp could mean a drop to SPX 2800 with strong resistance at 2825.  A drop is more likely with an immediate rally to SPX 2850 early in the week that holds thru Wed.


Fri PM, shows huge call positions at SPX 2875-900, while modest put open int show support up to 2845.


For Fri Aug 24, open int is much like last Fri where a strong market could push into the SPX 2830-50 area, but a weak market could drop to 2800-10.


IV. Technical/Other

Just wanted to take a look at a couple of charts for SPX and NDX that currently show possible ending diagonals.

The SPX looks like a move up to 2875 could set up a drop to the 200 SMA at 2700.


While the NDX looks a little more ominous on a longer time frame.


Conclusions.  The next two weeks could be a repeat of the last two weeks where several days of volatility created enough bearishness for a bounce up to SPX 2864 from 2794.  Overall bearish sentiment is starting to fade, and the next high could be followed by a larger decline down to SPX 2700.  The consensus of a drop to SPX 2790 is likely again to be surprised.  Aug 22 is the date that the current bull market from the Mar 2009 lows will exceed the 1991-2000 bull market as the longest in history and was followed by ten years of volatility like the 1970s.  What can we expect for the 2020s?
 
Weekly Trade Alert.  A retest of the previous two weeks could see a few days of whipsaw between SPX 2820-50 with increasing bearish sentiment before a move to ATHs.  A stronger move that holds near 2850, however, could see a late week fade like last week toward 2800.   Updates @mrktsignals.

Investment DiaryIndicator Primer,  update 2018.03.28  Dumb Money/Smart Money Indicators
Article Index 2018 by Topic
Article Index 2017 by Topic
Article Index 2016 by Topic
Long term forecasts

© 2018 SentimentSignals.blogspot.com