Saturday, December 10, 2022

Two Weeks to Xmas

I had been expecting a mild pullback last week to about SPX 4000, but apparently underestimated the strength of selling due to Wall Street bears calling for a recession in 2023 and recommending buying bonds and selling stocks.  As a result, the SPX fell more than expected to 3920 and bonds rallied more than expected, with the TNX briefly falling to 3.4%.  The week ending PPI disappointment, however, dispelled the bond rally with the TLT falling 2%+ and the TNX moving back to 3.6%.  Weakness in bonds later in the day also spooked stocks with a close near the weekly low.  SPX options OI is now showing little support for a rally next week with a range around current levels likely.

The Tech/Other section is a fedzilla where the Wall Street mantra for a recession in 2023 H1 due to the 10 Yr - 3 Mn Treasury curve is questioned by data from the St Louis and NY Fed that show that a recession is more likely in 2023 H2 and that int rates are likely to keep rising until unemployment rises.


I. Sentiment Indicators

The INT/LT Composite indicator (outlook 3 to 6+ months) has three separate components. 1st is the SPX and ETF put-call indicators (30%), 2nd the SPX 2X ETF INT ratio (40%), and 3rd a volatility indicator (30%) which combines the options volatility ratio of the ST SPX (VIX) to the ST VIX (VVIX) with the UVXY $ volume.

Update Alt. In this case the wts for the SPX 2X ETF ratio (SDS/SSO) and SPX puts & calls spread are adj to equal as in the DM/SM section for SPX ETFs.  Bearish sentiment has reached the level of Jan 2022 and any upside is likely to be very limited.

Update Alt EMA.  EMAs seem to be showing a declining trend and a topping pattern similar to Nov-Dec 2021 may be forming. The ST Composite as a ST (1-4 week) indicator includes the NYSE volume ratio indicator (NYDNV/NYUPV & NYDNV/NYDEC) and the UVXY $ Vol/SPX Trend. Weights are 80%/20%.

Update.  Bearish sentiment has now reached neutral but may rise further before a rally.


Update EMA.  No sustainable rally is likely.
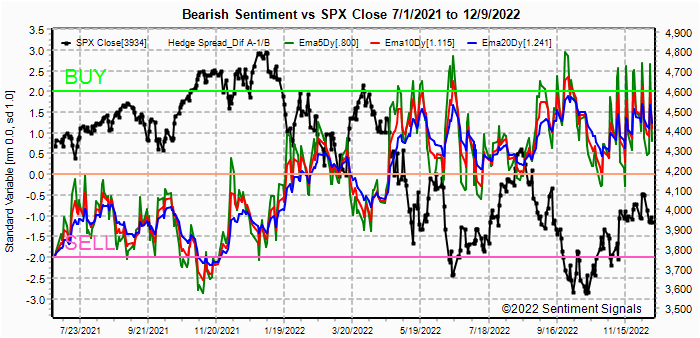
Update VIX Calls & SPXADP.  No update last week, so now is it.  This combo continues to generate a lot of signals, and is now at a weak Buy. The ST/INT Composite indicator (outlook 1 to 3 months) is based on the Hedge Spread (48%) and includes ST Composite (12%) and three options FOMO indicators using SPX (12%), ETF (12%), and Equity (12%) calls compared to the NY ADV/DEC issues (inverted). FOMO is shown when strong call volume is combined with strong NY ADV/DEC. See Investment Diary addition for full discussion.

Update EMA.  Hedging is very volatile supporting every little pullback and will likely limit downside.

Bonds (TNX).  Bearish sentiment in bonds has stopped moving lower and a sustained move higher in rates is possible at any time. For the INT outlook with LT still negative, the gold miners (HUI) bearish sentiment is presented in a new format using the data mining software to add the inverse TNX rate to the ETF ratio.

Update.  For the couple of months, I have been looking for a consolidation similar to early 2018 (about 180-220) and both  highs and lows were exceeded, but ETF sentiment is now dropping sharply as expected and a move below neutral could set up a collapse to 140 or lower.


II. Dumb Money/Smart Money Indicators

This is a new hybrid option/ETF Dumb Money/Smart Money Indicator as a INT/LT term (outlook 2-6 mns) bearish sentiment indicator. The use of ETFs increases the duration (term).

Update.  Sentiment remains at Sell extremes.

With the sister options Hedge Spread bearish sentiment as a ST/INT indicator (outlook 1-3 mns) indicates continued fear of an imminent decline and is more likely to see a clearing rally before a sustained decline.
For the SPX, I am switching to hybrid 2X ETFs plus SPX options. Taking a look at the INT term composite (outlook 2 to 4 mns) as bearish sentiment, options sentiment continues to show a bi-modal market and may be influenced by an increased in trading same-day options.  Prolonged topping as late 2021 is possible.
For the NDX combining the hybrid ETF options plus NDX 3X ETF sentiment with the interest rate effect,  (outlook 2 to 4 mns) bearish sentiment shows similar extremes between ETF and options as in late 2020 which resulted in a choppy market until options sentiment rose.  Note QQQ options are optimal, but are N/A and are included in ETF options.

Update.  Combined sentiment is now at the lowest level since Feb 2021.


III. Options Open Interest

Using Thur closing OI, remember that further out time frames are more likely to change over time, and that closing prices are more likely to be effected. Delta hedging may occur as reinforcement, negative when put support is broken or positive when call resistance is exceeded.  This week I will look out thru Dec 16. A text overlay is used for extreme OI to improve readability, P/C is not changed. Also, this week includes a look at the TLT for Dec exp.   A new addition is added for OI $ amounts with breakeven pts (BE) where call & put $ amounts cross.

With Fri close at SPX 3934, options OI for Mon is small, but lack of news could push prices back to the put support at 3950-4000 level.
Wed has smaller OI where SPX has weak put support up to 3950-4000.
For Fri AM strong OI with mostly hedged positions between SPX 3700-4000 may increase dealer incentive to drive prices toward BE at 3930.

For Fri PM moderate OI shows put support up to SPX 3975 and call resistance at 4000.

Currently the TLT is 106.3 with the TNX at 3.57%, the added puts at 105 and 110 may keep prices near current levels, ie, less likely to see 100.


IV. Technical / Other

This week I want to look at several charts from the St Louis and NY Fed.  The first chart is just an update of the chart shown a couple of weeks ago.  I had selected annual CPI when I wanted monthly annualized so 2022 was not available.  So this is the correction.

This is the FRED (St Louis) 10 Year - 3 Mo Treasury yield curve that everyone is using as a "perfect" predictor of recessions with most expecting a sharp recession in 2023H1.  Unfortunately the Fred data for 3 Mo starts in 1980 and may work in a secular bull market for bonds, but what about a secular bear market?

I just found this in AM, but the NY Fed has their own recession predictor model based on the same 10 Yr - 3 Mn Treasury spread back to 1960 where their research concluded that there is a 12 month lead time on average after an inversion before a recession (lower chart).  This shows that compared to the inflationary 1970s, the inversion is very mild so far and more importantly with the inversion occurring in Oct 2022, a recession is not expected until Oct 2023 (or at least H2).  So Wall Streets "buy bonds 2023 H1 and stocks H2" may be reversed.

Here I wanted to look at unemployment rate compared to the ten year yield, specifically that rising rates can lead unemployment by several years, but rising unemployment always precedes a recession in short order.  I am looking for something more like the late 1960s where rates continued to rise until unemployment rises.  Oddly, averages of both int rates (5.9%) and unempl rates (5.95%) are about the same over this time period.

Here, we see that the 2001-02 and 2008-09 recessions did not occur until after the yield curve un-inverted.


Conclusions.   Last week had more excitement than expected, all to the downside, and there doesn't seem to be a lot of indication for much excitement next week.  However, with CPI on Tue and FOMC Tue-Wed anything is possible.  ST there may be a move back to the SPX 4000 level, but the EOM heavy SPX call position at 3825 may hinder any further advance until early Jan when earnings and "no Fed" until late Jan may provide some breathing room for an advance.

Weekly Trade Alert.  A small advance is likely next week early to SPX 3950-4000 with some weakness into Fri AM with SPX OI$ BE at 3930 and then a higher close.  Updates @mrktsignals.

Investment Diary,  Indicator Primer, Tech/Other Refs,
 update 2021.07.xx  Data Mining Indicators - Update, Summer 2021,
 update 2020.02.07 Data Mining Indicators,
 update 2019.04.27 Stock Buybacks,
 update 2018.03.28 Dumb Money/Smart Money Indicators

Article Index 2019 by Topic, completed thru EOY 2020.02.04
Article Index 2018 by Topic
Article Index 2017 by Topic
Article Index 2016 by Topic

Long term forecasts

© 2022 SentimentSignals.blogspot.com

Saturday, December 3, 2022

Bad Cop, Good Cop

Bad Cop, Good Cop

Last week was one of my better weeks in a while as the overall outlook was a weak start (Mon SPX low -70), a strong Wed (SPX +100), and a weak Fri (SPX -50 at open), but the expected range was too conservative at SPX 3950-4050 (act 3937-4100).  Next week looks to be less exciting with some downward pressure toward SPX 3975-4000 (options OI) before a more important top optn exp week (Fri 16th).  Many traders were caught off balance by Powell's semi-dovish comments Wed, expecting a larger decline toward SPX 3800-900, and the result was a huge short-covering rally.  A look at the Dec 30 shows huge bullish OI positions down to SPX 3835 (JPM hedged equity fund), so the expected decline may occur later in the month, possibly supported by tax loss selling in the techs, still down 20%+ despite the huge rally in the DJIA.

Equities were also supported during the week by continued strength in bonds (lower rates) and so far the TNX has found support at 3.5%, but may be tested next week with continued economic weakness with ISM and confidence data.  I was surprised at how easily the strong jobs data and wage gains were shrugged off by bonds, as this is more supportive of stagflation with slower growth plus wage/price inflation pressure.


I. Sentiment Indicators

The INT/LT Composite indicator (outlook 3 to 6+ months) has three separate components. 1st is the SPX and ETF put-call indicators (30%), 2nd the SPX 2X ETF INT ratio (40%), and 3rd a volatility indicator (30%) which combines the options volatility ratio of the ST SPX (VIX) to the ST VIX (VVIX) with the UVXY $ volume.

Update Alt. In this case the wts for the SPX 2X ETF ratio (SDS/SSO) and SPX puts & calls spread are adj to equal as in the DM/SM section for SPX ETFs.

Bearish sentiment continued to push lower, especially in options, now approaching the levels of the Jan SPX top.

Update Alt EMA.  The more gradual decline in sentiment has prevented the EMAs from reaching the extremes of the Jan top. The ST Composite as a ST (1-4 week) indicator includes the NYSE volume ratio indicator (NYDNV/NYUPV & NYDNV/NYDEC) and the UVXY $ Vol/SPX Trend. Weights are 80%/20%.

Update.  NYSE volume data remains near neutral and is likely to fall before a significant SPX decline.


Update EMA.  The last strong sentiment signal was a Buy, and although below neutral, sentiment has not shown a Sell yet, so the Buy is still in effect. The ST/INT Composite indicator (outlook 1 to 3 months) is based on the Hedge Spread (48%) and includes ST Composite (12%) and three options FOMO indicators using SPX (12%), ETF (12%), and Equity (12%) calls compared to the NY ADV/DEC issues (inverted). FOMO is shown when strong call volume is combined with strong NY ADV/DEC. See Investment Diary addition for full discussion.

Update EMA.  Again, sentiment is below neutral, but not enough to end an upward trend.

Bonds (TNX).  Bearish sentiment in bonds is mostly unchanged as rates remain in the lower end of 3.5%-3.7% range. For the INT outlook with LT still negative, the gold miners (HUI) bearish sentiment is presented in a new format using the data mining software to add the inverse TNX rate to the ETF ratio.

Update.  Bearish sentiment fell sharply last week as a weak USD pushed up gold prices.


II. Dumb Money/Smart Money Indicators

This is a new hybrid option/ETF Dumb Money/Smart Money Indicator as a INT/LT term (outlook 2-6 mns) bearish sentiment indicator. The use of ETFs increases the duration (term).

Update.  New lows in bearish sentiment were seen last week.

With the sister options Hedge Spread bearish sentiment as a ST/INT indicator (outlook 1-3 mns), hedging remains high and is beginning to look like a mirror image to 2020-21. For the SPX, I am switching to hybrid 2X ETFs plus SPX options. Taking a look at the INT term composite (outlook 2 to 4 mns), bearish sentiment has reached new lows, mainly due to extremely bullish options positioning.
For the NDX combining the hybrid ETF options plus NDX 3X ETF sentiment with the interest rate effect,  (outlook 2 to 4 mns) bearish sentiment shows similar extremes between ETF and options as in late 2020 which resulted in a choppy market until options sentiment rose.  Note QQQ options are optimal, but are N/A and are included in ETF options.

Bearish sentiment is in the area of previous ST tops in 2022.


III. Options Open Interest

Using Thur closing OI, remember that further out time frames are more likely to change over time, and that closing prices are more likely to be effected. Delta hedging may occur as reinforcement, negative when put support is broken or positive when call resistance is exceeded.  This week I will look out thru Dec 9 + EOQ. A text overlay is used for extreme OI to improve readability, P/C is not changed. A new addition is added for OI $ amounts with breakeven pts (BE) where call & put $ amounts cross.

With Fri close at SPX 4072, options OI for Mon is small, where call resistance at and above SPX 4050 could push prices lower toward 4000-4025.
Wed has small OI where SPX has weak call resistance at/over 4025 that could push prices lower.
For Fri stronger OI with ;arge straddles at SPX 4000 and 4050 may keep prices in that range.
For Fri Dec 30 EOQ, strong OI dominated by SPX calls indicate that a pullback to 3800-3900 is likely.  The 42k call contracts at 3835 are worth about $24k a piece (likely JHEQX) and represent about 1/3 of the $2.8B dealer call exposure.


Conclusions.  Some economic weakness was expected to show up in last weeks data, but so far the effect on stock prices has been minimal with most of the effect seen in a lower dollar and int rates and higher commodity prices (inflationary).  The Fed heads seem to be playing "good cop, bad cop" and as a result creating more uncertainty with Bullard (bad cop) on Mon pressing for a more rules based policy (Taylor rule, meaning higher rates), while Powell (good cop, inflation is transitory) indicating more of a wait and see approach.  The strong jobs report is a leading indicator of corp profits, else why hire more workers if business is slowing down.  There does, however, seem to be a shift in hiring from high paying factory and tech to lower paying services sector.  This makes me less pessimistic about 2023 Q1, but leaning more toward stagflation.

Weekly Trade Alert.  A modest 1-2% pullback is expected next week to SPX +/-4000 with a test/best of 4100 the following week with CPI Tue 13th and FOMC 13-14th. Updates @mrktsignals.

Investment Diary,  Indicator Primer, Tech/Other Refs,
 update 2021.07.xx  Data Mining Indicators - Update, Summer 2021,
 update 2020.02.07 Data Mining Indicators,
 update 2019.04.27 Stock Buybacks,
 update 2018.03.28 Dumb Money/Smart Money Indicators

Article Index 2019 by Topic, completed thru EOY 2020.02.04
Article Index 2018 by Topic
Article Index 2017 by Topic
Article Index 2016 by Topic

Long term forecasts

© 2022 SentimentSignals.blogspot.com

Saturday, November 26, 2022

Everyone is Buying Bonds

Everyone is Buying Bonds

The SPX remained in the expected trading range of 3900-4000+ for Mon-Tue as int rates (TNX) remained near 3.9%, but Thur a sharp drop in rates to 3.7% pushed the SPX to 4030 and it remained near that level thru Fri.  Wall Street is certainly pushing bonds with the recent report by GS recommending buying gold and bonds and selling stocks and oil.  The feeling that inflation has peaked seems to be the rationale, but a look at other inflation surges in 1974 and 1980 shown in the chart below indicates that the correlation with TNX int rates may not be so simple.  Also, sentiment analysis for TLT below also shows that a sharp drop in bearishness is warning of problems ahead.

A couple of weeks ago, I showed a chart of TNX back to 1962 where a 60 year cycle brought rates back to the same level of 4%.  This week I want to look at TNX rates (red) relative to inflation (blu) over the same period.  For some reason the inflation data was missing for 2022, so I penciled in the approx inflation.  What is interesting is that in both 1974 and 1980 when inflation exceeded int rates by several percent as happened in 2022, int rates initially fell right after the peak in inflation, but then continued higher for a considerable amount of time (> 1 yr).  Essentially, this means that even if inflation declines, int rates may continue higher for some time.  The most likely scenario is that inflation eventually stabilizes around 3% similar to 2004-08 and int rates remain in the 4-5% area.

INT/LT sentiment indicators are at or near Sells indicating that a sharp downturn (10%+) in the next 1-4 mns is likely.  ST indicators show that SPX 4000 may provide support thru mid-Dec or later.  If the analog to late 2015 serves as a guideline with a retest of the June-Sept (SPX 3500-600) lows, this may presage a sharp rally to 4300-500 by the late Spring encouraged by a Fed pause or truce in Ukraine.  Tech/Other shows an update of the VIX call/SPXADP indicator and an expansion of the VIX term structure & SKEW indicator using ETF options.


I. Sentiment Indicators

The INT/LT Composite indicator (outlook 3 to 6+ months) has three separate components. 1st is the SPX and ETF put-call indicators (30%), 2nd the SPX 2X ETF INT ratio (40%), and 3rd a volatility indicator (30%) which combines the options volatility ratio of the ST SPX (VIX) to the ST VIX (VVIX) with the UVXY $ volume.

Update Alt. In this case the wts for the SPX 2X ETF ratio (SDS/SSO) and SPX puts & calls spread are adj to equal as in the DM/SM section for SPX ETFs.  An official Sell has been reached, but may become stronger before a strong decline begins.

Update Alt EMA.  Longer EMAs may need more time for strong Sell. The ST Composite as a ST (1-4 week) indicator includes the NYSE volume ratio indicator (NYDNV/NYUPV & NYDNV/NYDEC) and the UVXY $ Vol/SPX Trend. Weights are 80%/20%.

Update.  Indicator has turned down but only at weak Sell (-1 SD).


Update EMA.  Same as above. The ST/INT Composite indicator (outlook 1 to 3 months) is based on the Hedge Spread (48%) and includes ST Composite (12%) and three options FOMO indicators using SPX (12%), ETF (12%), and Equity (12%) calls compared to the NY ADV/DEC issues (inverted). FOMO is shown when strong call volume is combined with strong NY ADV/DEC. See Investment Diary addition for full discussion.

Update EMA.  Hedging continues to hold up this indicator.

Bonds (TNX).  Bearish sentiment in bonds has fallen sharply as the recent 0.5% drop produced the same sentiment change as the Aug-Jul 1.0 drop, supporting 3.5% as strong support. For the INT outlook with LT still negative, the gold miners (HUI) bearish sentiment is presented in a new format using the data mining software to add the inverse TNX rate to the ETF ratio.

Update.  ETF sentiment remains high supporting prices as long as int rates moderate.


II. Dumb Money/Smart Money Indicators

This is a new hybrid option/ETF Dumb Money/Smart Money Indicator as a INT/LT term (outlook 2-6 mns) bearish sentiment indicator. The use of ETFs increases the duration (term).

Update.  BTFD continues to push this indicator to an extreme Sell.

With the sister options Hedge Spread as a ST/INT indicator (outlook 1-3 mns),  bearish sentiment remains moderately strong and may support higher prices or a "controlled" decline. For the SPX, I am switching to hybrid 2X ETFs plus SPX options. Taking a look at the INT term composite (outlook 2 to 4 mns) as bearish sentiment, a sharp drop in both ETF and options sentiment has pushed this indicator to a strong Sell.
For the NDX combining the hybird ETF options plus NDX 3X ETF sentiment with the interest rate effect,  (outlook 2 to 4 mns) bearish sentiment shows similar extremes between ETF and options as in late 2020 which resulted in a choppy market until options sentiment rose.  Note QQQ options are optimal, but are N/A and are included in ETF options.

Update.  Sentiment has dropped to its lowest level since the Mar high/


III. Options Open Interest

Using Thur closing OI, remember that further out time frames are more likely to change over time, and that closing prices are more likely to be effected. Delta hedging may occur as reinforcement, negative when put support is broken or positive when call resistance is exceeded.  This week I will look out thru Dec 2. A text overlay is used for extreme OI to improve readability, P/C is not changed.  A new addition is added for OI $ amounts with breakeven pts (BE) where call & put $ amounts cross.

With Fri close at SPX 4026, options OI for Mon is very small and call resistance from 4000+ may push prices toward 4000 or lower.
Wed has somewhat larger OI where SPX has somewhat stronger put support at 4000 and call resistance at 4025 & 4050.  A range of 4000-50 is likely.
For Fri stronger call resistance at SPX 4000 is likely to push prices to or below that level.

For optn exp Fri Dec 16 AM, strong OI$ bullish bias of $10B is likely to pressure prices below SPX 4000, but huge straddle at 4000 may limit losses.


IV. Technical / Other

This week I wanted to take a brief look at the VIX call indicator plus SPXADP that may be setting up a double bottom similar to the SPX July top.

Combining the ETF calls and puts with the VIX/VXV & SKEW shows some interesting similarities between the periods of Aug 2018-Dec 2018 and July 2021 to Nov 2022.  First both periods started out with very low VIX/VXV & SKEW and high ETF calls and puts for a couple of months, then when the SPX declined in Oct 2018, the VIX/VXV & SKEW rose to +1.5 SD and the ETF calls and puts dropped sharply.  This time it took the same indicators almost a year to reverse as sharply from lower levels and now the highs in the VIX/VXV & SKEW are similar to Nov 2018, while the ETF calls and puts are making a double bottom, also similar to Nov 2018.  If the analogy continues, a sharp drop in SPX, possibly starting by late Dec, could push the VIX/VXV & SKEW to a Buy, setting the stage for a strong rally into the Spring.


Conclusions.  Most INT/LT indicators are warning the a significant decline of 10%+ is near with the exception of the Hedge Spread which may take several weeks of SPX 4000+ to turn around. The ST indicator is moving downward, but also needs more work to generate a Sell.  The way the bond sentiment is dropping, we may even see a Sell in bonds by the EOY.

Weekly Trade Alert.  SPX still likely to be range bound (3950-4050) unless int rates drop dramatically.  Updates @mrktsignals.

Investment Diary,  Indicator Primer, Tech/Other Refs,
 update 2021.07.xx  Data Mining Indicators - Update, Summer 2021,
 update 2020.02.07 Data Mining Indicators,
 update 2019.04.27 Stock Buybacks,
 update 2018.03.28 Dumb Money/Smart Money Indicators

Article Index 2019 by Topic, completed thru EOY 2020.02.04
Article Index 2018 by Topic
Article Index 2017 by Topic
Article Index 2016 by Topic

Long term forecasts

© 2022 SentimentSignals.blogspot.com