
Last week, I warned that the stock market sentiment was similar to Aug 2017 where a decline of SPX 70+ pts, including two large daily declines over a two week period. The result was a massive increase in bearish sentiment that lead to the melt up thru Jan. Last weeks decline was similar in size, but bearish sentiment was surprisingly mild. Will next week see more downside until bearish sentiment rises or will the bounce end up disappointing?
I. Sentiment Indicators
The overall Indicator Scoreboard (INT term, outlook two to four months) climbed sharply last reaching the level of the early Aug 2018 decline, but nowhere near the Aug 2017 pullback. Conclusion, potential for as much as SPX 100 pt rally next two to four weeks.

The INT view of the Short Term Indicator (VXX $ volume and Smart Beta P/C, outlook two to four months) also matched the early Aug 2018 bearish sentiment, but rather tame compared to Aug 2017. Conclusion, unlikely to generate strong rally similar to late 2017.

Bond sentiment (TNX) rose modestly to neutral similar to Jan that may indicate a continued rise to the 3.4 to 3.5% level before bearish sentiment puts the rate rally on hold.

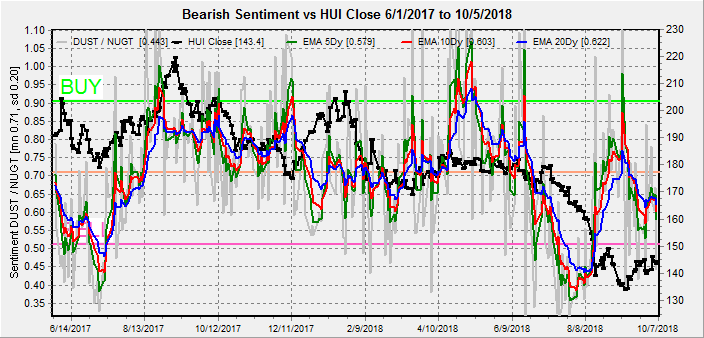
For the INT outlook with LT still negative, the gold miners (HUI) bearish sentiment seems to have stabilized below neutral as prices hold the 140-50 level.
II. Dumb Money/Smart Money Indicators - using all INT time frames this week
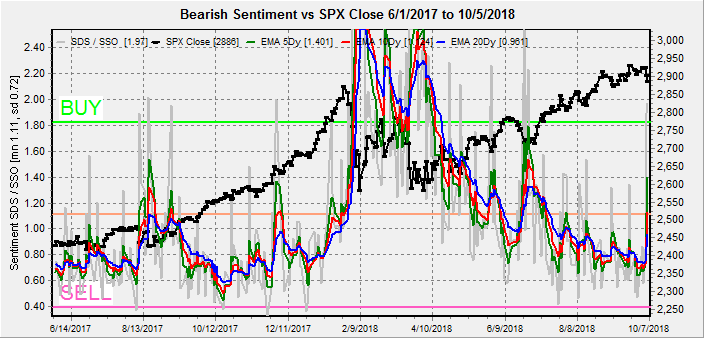
The Risk Aversion/Risk Preference Indicator (SPX 2x ETF sentiment/NDX ETF sentiment, outlook 2 to 4 days/weeks) as a ST/INT indicator remains near the bottom of its TL, showing preference for risk (NDX) remains high - a negative.

The option-based Dumb Money/Smart Money Indicator as ST/INT term (outlook 2 to 4 days/weeks) has also reached the levels prior to the Aug and Sept rallies that could mean an SPX 60 to 100 pt rally from the lows.

The INT term SPX Long Term/Short Term ETFs (outlook two to four weeks) bearish sentiment is relatively unchanged for the week at well below neutral. Looking more closely at separate ETF 2x/3x charts below, we see that this is due to strong selling by both long & short ETFS. The conclusion is both good and bad as the Dumb (2x) ETF selling is positive for the next few weeks, while the Smart (3x) selling is similar to that leading up to the Jan top, so the next high may be the last for a while.

The SPX ETF Dumb Money sentiment (2x) ST has risen to levels similar to Aug 2017, the highest since the June SPX 100 pt decline.
The SPX ETF Smart Money sentiment (2x) ST has risen even faster matching levels seen about two weeks before the Jan top as smart money was exiting well before the Feb crash, but were also heavy buyers mid Oct 2017 at the beginning of the rally.

Long term neutral, the INT term NDX Long Term/Short Term ETF Indicator (outlook two to four weeks) has risen to levels that were followed by moderate rallies in Aug and Sept.

III. Technical / Other
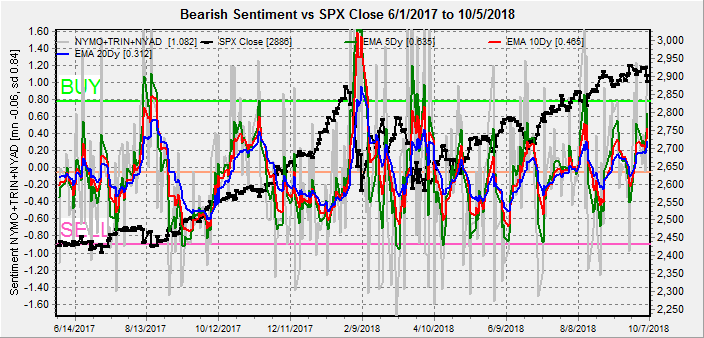
Last weeks decline was unusual in that the decline was on low volume and concentrated in large cap tech stocks. The result was that some of the indicators as TRIN do not show oversold/panic while others as NYMO do, so I just wanted the briefly mention the Technical Indicator Composite of NYMO+TRIN+NYAD +NYUD. Here, we see sentiment consistent with a moderate, but not strong advance.
Also as a followup on int rates, several times earlier in the year I noted that the TNX (black) was mostly following the two year T-Note (red) higher, and although last weeks rise in TNX rates seemed unexpected the result was just a catch up to the UST2Y. Apparently, since June the trade war talks had resulted in an inverted yield curve due to slower growth concerns, but recent data shows the opposite, probably due to retailers loading up on merchandise from China before the holiday shopping period when higher tariffs may be put in place. The increase in the trade deficit must have Trump scratching his head.

IV. Options Open Interest
Using Thurs close, remember that further out time frames are more likely to change over time. This week I will look out thru Oct 12. Put support is likely to be much stronger than shown due to Fri selloff. Mon/Wed/Fri looks pretty much the same with put support up to SPX 2900-10 and call resistance from SPX 2920-5.
With Fri close at SPX 2886, Mon has very light resistance up to 2920 if the market rallies, while declines have strong support at 2850. Light open int overall.

Wed is somewhat similar except that strong put support appears at SPX 2880, and strong call resistance is at 2920.

Fri shows larger open int with very strong put support at SPX 2900 (last week it showed 2880) and strong call resistance at 2925. Currently, SPX 2910-5 is the expected close.

Conclusions. Last week was a condensed version of what I was expecting over a couple of weeks as the bond implosion pushed stocks lower ST. Next week is likely to be volatile but both ST sentiment and options OI indicates the the market should stabilize over SPX 2900. Looking further out, the recent comparisons to the Nov-Dec 2015 topping period may turn out to be more prescient than expected. Sentiment supports a two to four week rally of SPX 80+ pts that may reach 2950-60 early Nov, but that a 10%+ decline is likely to start soon thereafter.
The risk aversion indicator's low readings for the past couple of months have been warning of tech weakness and we saw continued evidence of that last week. Tech stocks are effected by something bond investors call duration where longer term/lower coupon bonds vary more with int rate changes because capital returns are discounted more heavily when capital is received further out. Tech stocks that pay little or no dividends are like zero coupon bonds. As discussed in Feb, the sharp rise in int rates in 1999-2000 probably contributed to the tech stocks demise.
As a final note, after checking the historical data for 1987, the int rate problem with comparison to dividend yield was for the DJIA that now has a 1.9% yield, so the problem area would be when the TNX reaches 3.8-3.9%.
Weekly Trade Alert. Mostly BTFD, but seriously the risk/reward for longs is not very tempting and I see no reason to short. Updates @mrktsignals.
Investment Diary, Indicator Primer, update 2018.03.28 Dumb Money/Smart Money Indicators
Article Index 2018 by Topic
Article Index 2017 by Topic
Article Index 2016 by Topic
Long term forecasts
© 2018 SentimentSignals.blogspot.com
Outstanding work.keep it up.
ReplyDelete