
On the virus front, last news out Friday indicated that Trump's favorite treatment HCQ was of no benefit treating CV and increased mortality due to heart problems in a world-wide study of 69k patients, while the Wall Street favorite Remdesivir was shown to have no statistical benefit in a published research article.
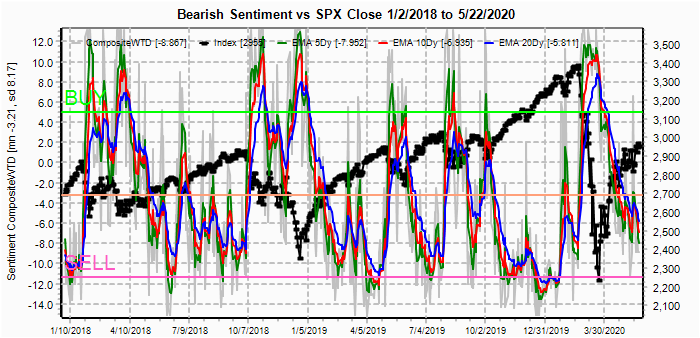
I. Sentiment Indicators
The overall Indicator Scoreboard (INT term, outlook two to four months) bearish sentiment continues to decline in a stair step fashion, indicating a ST pullback is likely.
The INT view of the Short Term Indicator (VXX $ volume and Smart Beta P/C [ETF Puts/Equity Calls], outlook two to four months) bearish sentiment continues to decline sharply, indicating that a short, but sharp, decline is possible. Sentiment is similar to May 2019 where a drop was seen from SPX 2945 to 2729.

Bonds (TNX). Interest rates remain mostly unchanged as is sentiment.

For the INT outlook with LT still negative, the gold miners (HUI) bearish sentiment is somewhat less extreme with the small pullback to GDX 280.

II. Dumb Money/Smart Money Indicators
The option-based Dumb Money/Smart Money Indicator as short/INT term (outlook 2 to 4 mns/weeks) bearish sentiment comparable to the Jan and Dec 2018 tops as well as Jan 2020. This could mean a sharp but short decline is likely, but the Overall Composite indicates it will likely be a buying oppty.

And the sister options Hedge Ratio bearish sentiment is lagging, so only a moderate increase in volatility is expected, but sentiment is comparable to May 2019 which saw a 200+ pt drop in the SPX.

III. Options Open Interest
Using Thur closing OI, remember that further out time frames are more likely to change over time, and that closing prices are more likely to be effected. Delta hedging may occur as negative reinforcement when put support is broken or call resistance is exceeded. This week I will look out thru May 29. Also, This week includes a look at the TLT for Jun exp.
With Fri close at SPX 2955, options OI for Tue (date is 26th not 25th) show little bias between put support at 2875 and 2975. Likely range is SPX 2945-65.

Wed has similar OI size where SPX OI resembles a mirror image of last Mon which saw little call resistance until 2950 and resulted in a 100 pt rally. Now, there is a negative bias down to 2900 and little put support until 2800, so the almost certain China passage of the "national security law" aimed at HK may cause a sharp decline toward the 2800 level.

For Fri, large OI shows strong resistance over SPX 2850, but large positions at 2800, 2850 and 2900 are offset as straddles, and relevant support seems to be the puts at 2825 and call resistance at 2880.

For next Fri (jobs report), overlapping OI indicates a wide possible range between SPX 2800 and 2950 that will likely change depending on next weeks action.

Using the GDX as a gold miner proxy closing at 35.5, remains in positive delta hedging.
Currently the TLT is 165.5 with the TNX at 0.66%, there is a slight negative bias with put support at 160 and call resistance at 165.

IV. Technical / Other
Two of the most informative indicators from the data mining software have been the SPX hedge spread (SPX puts - ETF calls) and the Crash Indicator. The SPX hedge spread is mildly negative, indicating that a major top is not expected, while the Crash Indicator is essentially neutral.


The conclusion is that a decline is expected similar to May 2019 that may last 1 to 3 weeks and possibly range between the 100 SMA at 2970 and 50 SMA at 2730.

Conclusions. A temporary downturn should begin next week that will likely be attributed to increasing tensions between the US and China as China seems to be ready to move ahead with a crackdown on dissidents in Hong Kong under the guise of a national security law (not unlike the US DHS being given free reign to prosecute anyone labelled a terrorist). If similar to May 2019, the decline will likely be an ABC with the first target around SPX 2800 which options OI indicate could happen next week.
Weekly Trade Alert. An early week bounce to SPX 2965-75 would be a good target for a ST short targeting SPX 2800-20. Updates @mrktsignals.
Investment Diary, Indicator Primer,
update 2020.02.07 Data Mining Indicators,
update 2019.04.27 Stock Buybacks,
update 2018.03.28 Dumb Money/Smart Money Indicators
Article Index 2019 by Topic, completed thru EOY 2020.02.04
Article Index 2018 by Topic
Article Index 2017 by Topic
Article Index 2016 by Topic
Long term forecasts
© 2020 SentimentSignals.blogspot.com
No comments:
Post a Comment