
"Sell in May" may have become too popular short term with a sharp pickup in put/call ratios on Fri and the TRIN showing its highest reading since early Mar at 1.8. What this does ST is raise the possibility of a corrective reversal to new highs (b-wave) before the decline continues. Over the last two weeks, I have mentioned the potential for a more complex tops and bottoms for a retrace and retest of the lows similar to Mar-Apr 2018 after the Feb 2018 volmageddon. The chart below shows an example from 2018. Currently, I am looking at this as a 40% probability and it should be evident early next week if there is a lack of follow thru to the downside. The potential is for a low above SPX 2800, a mid week rally possibly to SPX 2850-75, a retest of the lows, then a rally back to SPX 2950+ by May 15 optn exp. The preferred scenario at 60% is a low next week at SPX 2750-800, then a rally into optn exp to 2900-30.

I. Sentiment Indicators
The overall Indicator Scoreboard (INT term, outlook two to four months) bearish sentiment has moved well below that seen for Mar 2018 and Dec 2018 down legs which is to be expected since the Mar decline was 7% and Dec 2018 was 15%. A retest of the lows in 2020 would be a decline over 20%.

The INT view of the Short Term Indicator (VXX $ volume, no SPX vol adj, and Smart Beta P/C [ETF Puts/Equity Calls], outlook two to four months) bearish sentiment fas seen a similar drop below neutral to levels comparable for a low retest.

Bonds (TNX). Bearish sentiment is at extreme lows.

For the INT outlook with LT still negative, the gold miners (HUI) bearish sentiment remains at extreme lows as HUI prices are more reflective of the deflationary prices of bonds.

II. Dumb Money/Smart Money Indicators
The option-based Dumb Money/Smart Money Indicator as short/INT term (outlook 2 to 4 mns/weeks) bearish sentiment bounced of recent lows similar to the Jan and Dec 2018 tops and may be following the pattern of the Dec 2019 price highs.

And the sister options Hedge Ratio sentiment is closer to neutral, indicating the volatility is unlikely to be as extreme as Mar 2020 or Feb and Dec 2018 if there is a retest of the lows.

III. Options Open Interest
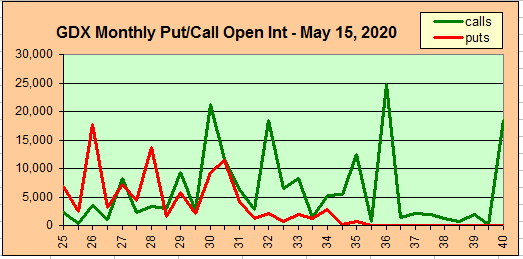
Using Thur closing OI, remember that further out time frames are more likely to change over time, and that closing prices are more likely to be effected. Delta hedging may occur as negative reinforcement when put support is broken or call resistance is exceeded. This week I will look out thru May 8. Also, This week includes a look at the GDX for May exp.
Note, the high pit/calls seen during Fri decline are not reflected in the data shown as of Thur close, so put support is likely to be much higher. Watch for Mon update (Twitter).
With Fri close at SPX 2831, options OI for Mon is moderate and shows call resistance at SPX 2860 and put support at 2780. Fri decline probablly increased support from 2800-10,

Wed has much smaller OI where SPX and currently shows potential for a whipsaw if an early week rally reaches SPX 2850 to back toward 2800.

For Fri, moderate overall OI shows only light call resistance at SPX 2850 and 2900 with put support at 2780. With strikes between SPX 2800 and 2900 hedged, changes due to Fri decline and daily price action will likely determine bias.

Using the GDX as a gold miner proxy closing at 33.30 has pushed over call resistance at 30 and 32 with stronger resistance at 36. Strength in SPX into optn exp could pressure price down toward 30 level.
Currently the TLT is 168 with the TNX at 0.64% with the strong call resistance at 170.
IV. Technical / Other
This week I wanted to update a couple of LT outlooks for the NYSE Up/Dn vol and AD Line. The Up/Dn Vol continues to follow the pattern seen after the Aug 2015 flash crash which consisted of a retest of the lows, a 90%+ retracement before a final lower low to kick of a multi-year rally of almost 100% from the SPX 1800 level. This is my preferred scenario for 2020-21+.

The NYSE ADLine continues to show strength, indicating that even a partial retrace is likely to be followed by a strong rally that may even make new highs before a more significant down leg as seen of Q4 2018.

Conclusions. With last weeks spike over SPX 2900, I am updating my extended price range to SPX 2600-3000. "Is America now open for business, and what will be the result" are the questions whose answers will continue to shape the stock markets performance going forward. Early indications from other countries and even more lenient US states indicate that open for business also means open for new infections, so an initial sigh of relief may be followed by remorse. The result could be a lengthy trading range over the summer with a new flu season in the Fall and US elections providing a new round of high risk outcomes. The alternative, more consistent with previous sharp declines, is a disappointing economic comeback that results in a retest of the SPX lows with new beginnings and medical advances in the Fall that begin a new bull market lasting several years.
Weekly Trade Alert. Next week is important as bottoming action above SPX 2800 could mean an optn exp rally back to 2950, while a break of 2800 likely means a retest of the lows has begun. Updates @mrktsignals.
Investment Diary, Indicator Primer,
update 2020.02.07 Data Mining Indicators,
update 2019.04.27 Stock Buybacks,
update 2018.03.28 Dumb Money/Smart Money Indicators
Article Index 2019 by Topic, completed thru EOY 2020.02.04
Article Index 2018 by Topic
Article Index 2017 by Topic
Article Index 2016 by Topic
Long term forecasts
© 2020 SentimentSignals.blogspot.com
No comments:
Post a Comment