
Sentiment is unclear at the moment as to whether further downside is imminent or more rally is likely. Currently, options Oi indicates at least a retest of the SPX 2750 area by EOM.
I. Sentiment Indicators
The overall Indicator Scoreboard (INT term, outlook two to four months) bearish sentiment has gone from a very weak SELL a week ago to neutral that may mean some strength ahead before further weakness, while a continued decline would generate a weak BUY.

The INT view of the Short Term Indicator (VXX $ volume and Smart Beta P/C [ETF Puts/Equity Calls], outlook two to four months) bearish sentiment remains well below neutral indicating that continued volatility should be expected.

Bonds (TNX). Bond sentiment remains at extreme lows, while some, including GS, are warning that the $3T bailout package could pressure interest rates when bonds are sold to finance the bailout if the Fed does not go full MMT to monetize the debt.

For the INT outlook with LT still negative, the gold miners (HUI) bearish sentiment remains near extreme lows as record bailout has convinced gold bugs that hyper-inflation is on the way..

II. Dumb Money/Smart Money Indicators
The option-based Dumb Money/Smart Money Indicator as short/INT term (outlook 2 to 4 mns/weeks) remains near recent lows indicating the recent rally has likely run out of steam.

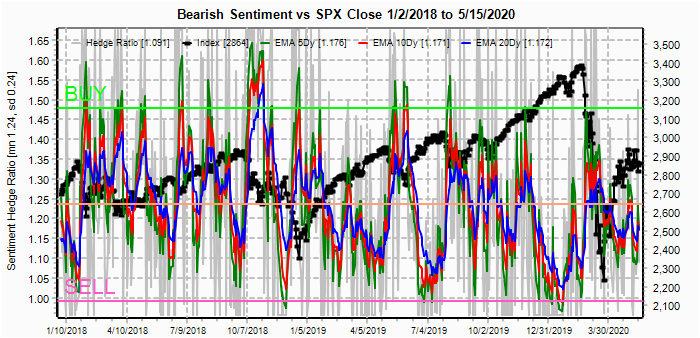
And the sister options Hedge Ratio sentiment has moved toward neutral, and that may be enough to cause a pause in the current downtrend.
III. Options Open Interest
Using Thur closing OI, remember that further out time frames are more likely to change over time, and that closing prices are more likely to be effected. Delta hedging may occur as negative reinforcement when put support is broken or call resistance is exceeded. This week I will look out thru May 29. Also, This week includes a look at the GDX for Jun exp.
With Fri close at SPX 2864, options OI for Mon shows modest put support at SPX 2750 and call resistance at 2960 with little in between. The small call resistance starting at 2850 may mean a negative start to the week.

Wed has somewhat larger OI where SPX put support moves up to 2850 with minimal call resistance up to 2900 and may result in a continuation of the rally off of last weeks lows.

For Fri, large OI may influence weekly behavior and shows strong put support at SPX 2825 and below and the key is what happens at 2875. If early weakness during the week increases put support, a move over 2875 has only small call resistance up to 2940 then 2975.

For May 29 EOM, other than the large straddles at SPX 2800, 2850 and 2900 there is little put support until 2750 with small call resistance at 2875 and over 2900. A wide range of prices is possible, although OI is likely to change over the next week or two.

Using the GDX as a gold miner proxy closing at 36.57, Fri jump over the strong call resistance at 35 has opened up the potential of positive dynamic hedging pushing price toward 40, but dynamic hedging can also result in strong whipsaws by exp.

Currently the TLT is 166.7 with the TNX at 0.64% and the strong call resistance at 170 has held.
IV. Technical / Other
One of the reason I have a hard time being too bearish at the moment is the Crash Indicator that remains modestly positive. Although not as strong or as timely as I would have liked, the Jan SELL did finally prove prescient and a decline to -1.0 is likely before a larger decline.

Also, reviewing some of my archived charts, I ran across a Bradly Turn Chart from 2014 (the last year they were published), and surprisingly It seems to fit well for what sentiment seems to be saying to expect for 2020.

Conclusions. Recent progress in the antibody approach to treating Covid-19 seems to be very promising, although largely ignored by the markets. The biggest hurdle to returning the US economy to normal after a near complete shutdown is that the cost and time to do so are likely to be greater than any one expects, and Trumps "everything is great" speech at the SOTU is not going to go very well at the Nov election. Now Trump seems to be using China as the bogeyman to deflect blame from himself, but can also prove longer term problematic for the markets. Particularly, using the near monopoly of advanced computer chips by the US and Taiwan, the threat of cutting off sale of chips to China may force China to use a more aggressive approach to integrate Taiwan with the mainland.
Weekly Trade Alert. Lower prices to SPX 2750 are likely by EOM, but it is difficult to tell if more rally is likely first. Breakdown from the bear flag shown last week could see a retest of the lower TL near 2940 Fri before lower prices. Updates @mrktsignals.

Investment Diary, Indicator Primer,
update 2020.02.07 Data Mining Indicators,
update 2019.04.27 Stock Buybacks,
update 2018.03.28 Dumb Money/Smart Money Indicators
Article Index 2019 by Topic, completed thru EOY 2020.02.04
Article Index 2018 by Topic
Article Index 2017 by Topic
Article Index 2016 by Topic
Long term forecasts
© 2020 SentimentSignals.blogspot.com
No comments:
Post a Comment