
The SPX does seem to be approaching a more important top with next week expected to reach the target of 2950-75 with a double top for the ES at 2970-80. The last decline was 5% and this time I expect a full 10% to 2600-50, possibly followed by another b-wave higher. Timing-wise, Raj at Times&Cycles is projecting a flash crash cycle for late May and M.Armstrong has a panic cycle scheduled for the week of May 25th.
Many are expecting SPX 2450, but a series of b-waves are possible with higher highs and lower lows to confuse and frustrate the bears. Currently the futures are following a bear flag that points to SPX 2600-50 upon breakdown.

There is also a setup for negative RSI divergence.

I. Sentiment Indicators
The overall Indicator Scoreboard (INT term, outlook two to four months) bearish sentiment has dropped much lower than Mar & Nov of 2018 before retest or lower lows and is a sign of strength. Higher highs are likely in the months ahead, but larger problems are likely in the Fall.

The INT view of the Short Term Indicator (VXX $ volume and Smart Beta P/C [ETF Puts/Equity Calls], outlook two to four months) bearish sentiment has fallen very sharply and may generate a SELL in the next week or two.

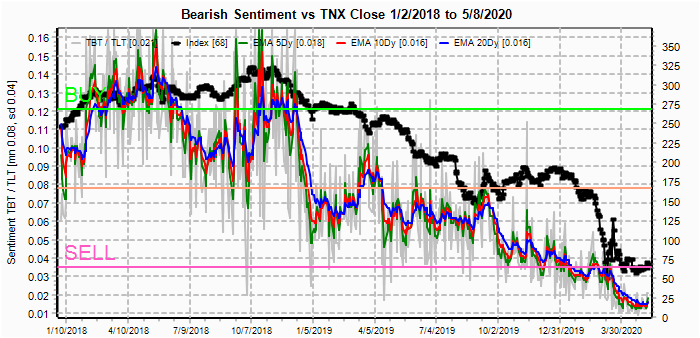
Bonds (TNX). Interest rates may have bottomed in the 0.50-0.75% range. As discussed by Nomura's C.McElligott, this may be a sign of bear steepening as supply due to the expanding deficit outstrips demand.
For the INT outlook with LT still negative, the gold miners (HUI) bearish sentiment remains extremely low as easy money fuels the demand for safe havens.

II. Dumb Money/Smart Money Indicators
The option-based Dumb Money/Smart Money Indicator as short/INT term (outlook 2 to 4 mns/weeks) is warning of extreme complacency by options speculators similar to early 2020.

And the sister options Hedge Ratio sentiment is finally showing the sharper reduction in hedging that precedes most significant declines.

III. Options Open Interest
Using Thur closing OI, remember that further out time frames are more likely to change over time, and that closing prices are more likely to be effected. Delta hedging may occur as negative reinforcement when put support is broken or call resistance is exceeded. This week I will look out thru May 15. Also, This week includes a look at the TLT for May exp.
With Fri close at SPX 2930, options OI for Mon is somewhat light, but the SPX has risen over put support and the 2920-40 area is the likely range.

Wed has very small OI where SPX has some put support up to 2910 and very little call resistance up to 2980. With Fed chair Powell scheduled to speak this may be an opportunity to spike up to the 2950-75 area.

For Fri, moderate OI is composed mostly of straddles. The largest straddle is at SPX 2950 and may be a point of attraction if there is no news event, otherwise volatility could reign as calls provide a negative bias down to 2800.

Currently the TLT is 164 with the TNX at 0.68%. Two weeks ago with the TLT near 170, I pointed out the strong call resistance and a lack of put support and prices have fallen about 3% since then. The announcement that the Treasury will be financing "the covid related bailouts" by issuing 20 yr bonds will likely continue to pressure LT bonds.

IV. Technical / Other
One of the LT indicators that continues to worry me is the daily NYSE McClellan Summation Index. Comparing the current reading of 160 to other rallies off of bear market bottoms as some are claiming this is, such as Mar 2009, Feb 2016 and Dec 2018, the Summ Index reached +1000 quickly, while this rally looks more like 2008. This may be due to concentration in FAAMG leadership as "work at home" places increased dependence on tech, but raises questions as to the strength of the economy.

Conclusions. The unusually strong response by the Fed to support the markets coupled with large stimulus from Congress has resulted in a very strong bounce in the markets, but I continue to feel that markets are not as healthy as they appear. The Summ Index is a good example of underlying weakness, and as a measure of Adv/Dec issues and volume, it shows that there is no broad based rally that is usually seen at the end of bear markets.
That being said, markets can continue to rally until the bears run out of money and I expect an 80-90% retracement to SPX 3100-300 similar to Dec 2015 before the next major plunge. The road to the top could be very winding, however. There are timing cycles that point to a 10-15% correction starting the next two weeks that will probably be followed bu another strong rally to at least 3000. Depending on sentiment that may be where a larger retest begins to 2250-450.
Weekly Trade Alert. The next week or so should provide a top before at least a 10% decline. My target for a top is SPX 2950-75 and for a bottom is 2600-50. Updates @mrktsignals.
Investment Diary, Indicator Primer,
update 2020.02.07 Data Mining Indicators,
update 2019.04.27 Stock Buybacks,
update 2018.03.28 Dumb Money/Smart Money Indicators
Article Index 2019 by Topic, completed thru EOY 2020.02.04
Article Index 2018 by Topic
Article Index 2017 by Topic
Article Index 2016 by Topic
Long term forecasts
© 2020 SentimentSignals.blogspot.com
No comments:
Post a Comment