
I. Sentiment Indicators
Today I am going to take a short term outlook (2017-8, and Short term EMAs) for the SPX and NDX, but stick to regular time frames and EMAs for bond and gold miners ETFs. First, the overall Indicator Scoreboard has dropped somewhat, but given the length of time spent below average since the beginning of 2017, an extended period of higher bearish sentiment is to be expected and is not immediately bullish.

The Short Term Indicator (VXX $ volume and Smart Beta P/C) fell to neutral before the recent pullback and also appears to be locked in a more elevated range.

The overall put/call ratio (CPC Revised, ie less VIX options), which after several failed attempts did call the Jan top, has seen the sharpest decline, but this may be partially due to high premiums.

While the ETF sentiment shown by the NDX SQQQ/TQQQ ratio has the most elevated bearish sentiment, but is comparable to the SPX ETFs as well. Given the fact that bearishness began in early Jan, I am starting to think that this may represent "smart money" since they stayed bullish through much of the uptrend and may not support the "1999 type blowoff".

Bearish bond sentiment (TNX) has declined slightly with the recent consolidation in rates but still supports further consolidation before rates move higher.

The gold miners (HUI) bearish sentiment is now at its lowest level of the past few months even as prices approach the lows of over a year ago as many seem to feel that inflation or safe haven demand will push prices higher.

II. Options Open Interest
I want to start by reviewing last Fri SPY (close 269.1, SPX 2691) open int as it shows an important lesson as to how open int may or may not work. By Wed the SPY 270 put open int increased by 50k. As discussed in the Investment Diary under "new options", put writers will usually hedge a new position by selling SPX futures which puts downward pressure on prices temporarily. But with the events of last week including Howells testimony in Congress and Trumps trade policy, the apparent "strong" support at 270 proved to be the opposite when the market fell below 270 and due to negative delta hedging resulted in a collapse to 2647. Since the main effects of open int is seen at expiration, a last hour rally was able to push prices back to the 269 level.

Now with M/W/F options, there may be more short term rotation and for now Mon has more options than Wed. There is not much put support until 265 then 263 and not much resistance until 276 so wild swings are possible.

For Wed, with current small sizes, resistance moves up to SPY 268 with "most likely" at 271, but a break below 268 shows little support until 260. These are likely to change as Mon positions are rolled over.

For Fri, we have an unusual pattern of high puts and calls both at 230. Normally, this is the "most likely" pin.
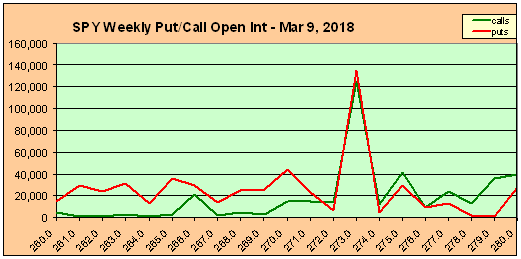
Looking forward to options exp week of Mar 16, the "most likely" is 274-75 with a potential range of 270-280.

To clarify, I decided to look at the SPX options. Here we see much stronger support at 2650, 2680 and 2700. Each contract is 10x the value of an SPY contract so the sizes are significant and indicate a similar position to the SPY Mon options.

For Fri, the SPX results are similar to the SPY with a "most likely" pin at 2720.

III. Technical Indicators
Today, I am going to take a closer look at the 2015 flash crash retest which I should have done last week. I was looking at the duration of the decline (9 days), but the 2018 decline topped in the third day of the breakout over the 50 day SMA, then reversed with a four day drop to a low.

The numbers below show comparable results for the two periods using the ratio of the SPX level (2700/2000) as an adjustment for the price changes. So far the first decline and subsequent rally were very close to the predicted levels, but it remains to be seen if the next low near 2600 will materialize.

Conclusions. Last week followed the 2015 fractal much closer than I expected which now raises the question of whether the "retest" is over or whether there will be a lower low next week. Personally, although the Fri rally seemed strong, it was also most likely to to the expiring puts and was not strong enough to get to 270. Options open int does not give much guidance other than a likely Fri close near SPX 2720-30. Sentiment is also inconclusive, so my best quess is a slightly lower low near SPX 2635-40, possibly Wed-Thu. The weekly Unemployment Initial Claims hit the lowest level since 1969 so the monthly jobs report is likely to be strong, but the strongest reaction may from the Wed ADP release, leaving Fri to rally.
Weekly Trade Alert. Admittedly, I keep getting close but "no cigar" and this week is probably harder than the last. We could see SPX 2600 if the bond market is spooked and the TNX spikes to 3.0%, but it doesn't seems likely with current sentiment. So shorting doesn't seem like a good bet but a decline to a lower low Wed/Thu SPX 2635-40 is a BUY if the TNX is below 3.0%. Updates @mrktsignals.
Investment Diary, Indicator Primer, update 2018.02.23 ETF Sentiment Revision
Article Index 2018 by Topic
Article Index 2017 by Topic
Article Index 2016 by Topic
Long term forecasts
© 2018 SentimentSignals.blogspot.com
No comments:
Post a Comment