
I. Sentiment Indicators
Using regular EMAs. The overall Indicator Scoreboard uses a folded view to compare the 2018 selloffs to the flash crash of 2015. Here, we see that bearish sentiment never reached the extremes of Aug 2015 and at the SPX 2800 top had declined almost to neutral before the most recent decline to SPX 2585. Sentiment has now reached the levels of the previous 2647 lows and is now consistent with a rally to 2750, but for reasons discussed later I doubt if 2800+ is seen again any time soon.

The Short Term Indicator (VXX $ volume and Smart Beta P/C) has seen a much sharper increase than the Indicator Scoreboard, but less than that of the Feb lows which was followed by an SPX 240+ pt rally, so a rally of about 200 pts from the lows may be possible.

Bearish bond sentiment (TNX) has continued to rise even as rates have slowly declined which should provide a mildly positive back drop for stocks and gold miners.

The gold miners (HUI) bearish sentiment saw a sharp spike last week as prices made a new low then reversed sharply. This mirrors almost exactly the pattern of May 2017 when the HUI rallied from 182 to 205, a similar move from 168 would target 191.

II. Dumb Money/Smart Money Indicators
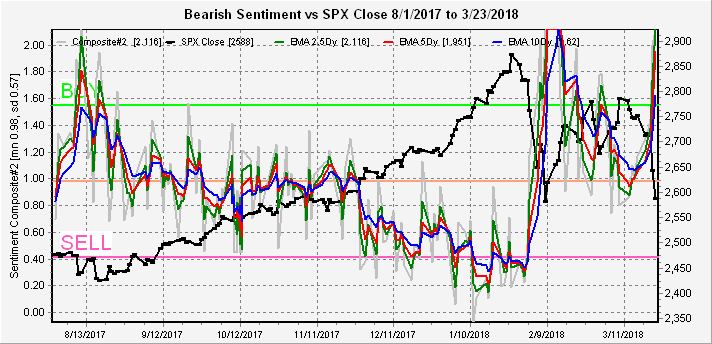
Over the last two years I have looked at a number of combinations of indicators looking for dumb/smart money indicators with little success, but a couple of weeks ago I tried something that seemed to work and have been trying to fine tune the results ever since. As you can see from the main stock indicators extreme sentiment at tops and bottoms makes identifying buys and sells more difficult and one of the first things i noticed was that using a ratio of similar indicators removed much of the "cyclicality". This particular combination is also more volatile yielding several signals a month. So I will be using this indicator with s/t EMAs for 6 month periods.
As you can see below the indicator gave several buys and sells in the volatile Aug 2017 period and became extremely bullish in Nov 2017. The two sells in Jan were followed by a one day SPX 30 pt decline then the Jan 31 sell was followed by a 300 pt decline. The Mar 15 sell at SPX 2750 has seen a 165 pt decline so far. Current sentiment has risen only to just above neutral, but much of the signal is directional and we have now reached the level of the recent SPX 2647 low before the rally to 2800, so a 150 pt rally may be expected soon. The two declines above started two days after the signal and many signals seem to occur during consolidation periods or "nests" as some analysts call them as investors position for the next move, when dumb money positions for a rally and smart money positions for a decline, watch out below.

The second component of this indicator is a cyclicality version when combined with the BPSPX/CPCE ratio. Here we see that the cyclicality version is similar to the ST Composite and would support a stronger than SPX 150 pt rally. The cyclicality seems to magnify signal strength in the same direction and dampen for the opposite direction.
Next, i was wondering if there may be any correlation with this effect and the recent weakness in the tech sector. To look at this I noticed that the 2x ETFs were less bearish than the 3x ETFs so I looked at the long term 2x QID/QLD as dumb money sentiment and the 3x SQQQ/TQQQ as smart money and came up with this short term view. With the very weak bearish sentiment it is no wonder that the NDX has been so weak. Note cyclicality makes it difficult to use longer periods.

Doing the same for the SPX ETFs using the 2x SDS/SSO as long term dumb money sentiment and the 3x short term SPXU/UPRO as smart money, the results are even more impressive without the cyclicality problem. More smart money flowed into the market at the beginning and end of 2017, while more dumb money flowed in before the July and Aug 2017 pullbacks as well as the Dec 2017 and Jan 2018 tops. The outlook is much more positive for the SPX than the NDX, now reaching the equivalent of the May and Aug 2017 lows.

III. Technical Indicators
Just two short notes here for the DJIA and SPX. The DJIA looks very much like a H&S that is targeting the 200 SMA at 23,360.

The SPX still may form a slightly larger bear flag than originally expected with a low in the low 2570s. With the DJIA about 170 pts from its 200 SMA, both indices seem to be lining up for coincident touches. I am expecting Mon to be about the same as the early Mar 2647 low.

Conclusions. The downside move was not unexpected, but the strength was. Given the SELL shown by new the Dumb/Smart Money Indicator, it could have been predicted. A bottom is likely very near, and I am hoping Mon sees an up, down, up sequence bottoming in the SPX 2570s with the DJIA at 23,360ish. Most are expecting a very strong rally to at least new recovery highs, but I think a weaker rally for the next two months or so to SPX 2780s to set up a H&S pattern is more likely. The NDX fell below its 100 SMA and is likely to under perform the SPX with a test of its 200 SMA likely this summer.
Weekly Trade Alert. The year started with the SPX at 2675 (Dec 29) and its likely we retest that level next week to end the quarter flat. Look for a long with the SPX in the 2570s Mon/Tue with a S/T target of 2670. Updates @mrktsignals.
Investment Diary, Indicator Primer, update 2018.02.23 ETF Sentiment Revision
Article Index 2018 by Topic
Article Index 2017 by Topic
Article Index 2016 by Topic
Long term forecasts
© 2018 SentimentSignals.blogspot.com
No comments:
Post a Comment