
Last week managed to exceed my expections for a pullback to test the Sept highs (SPX 4530-50) with a decline down to 4495, but signs of panic are starting to appear with many now expecting the 4300s, and similar to the recent highs which exceeded my upside expectations temporarily, this is likely to produce a snapback similar to the stretching of a rubber band.
Sentiment measures are somewhat of a mixed bag with ST/INT (options based) nearing levels where a rally should occur while INT/LT (ETF based) are becoming even more extreme for low bearishness. The most likely outcome still appears to be a Xmas rally (60% prob) before an even larger decline starting early 2022. This week John Mauldin discusses one possible reason for continued strength in the ETFs.
I. Sentiment Indicators
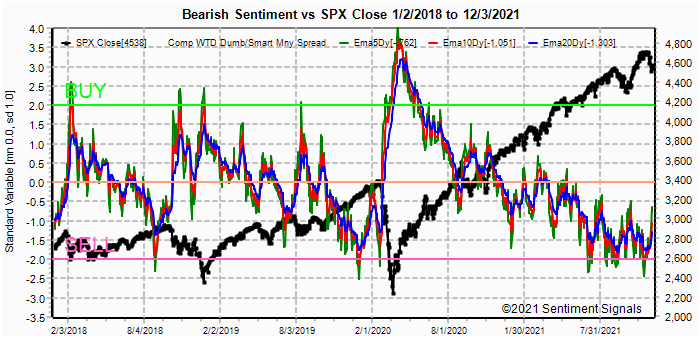
The INT/LT Composite indicator (outlook 3 to 6+ months) has three separate components. 1st is the SPX and ETF put-call indicators (30%), 2nd the SPX 2X ETF INT ratio (40%), and 3rd a volatility indicator (30%) which combines the options volatility ratio of the ST SPX (VIX) to the ST VIX (VVIX) with the VXX $ volume.
There has been a modest increase in bearish sentiment in the INT/LT Composite which was largely unchanged by the late Sept decline, but still remains near the Sell level.

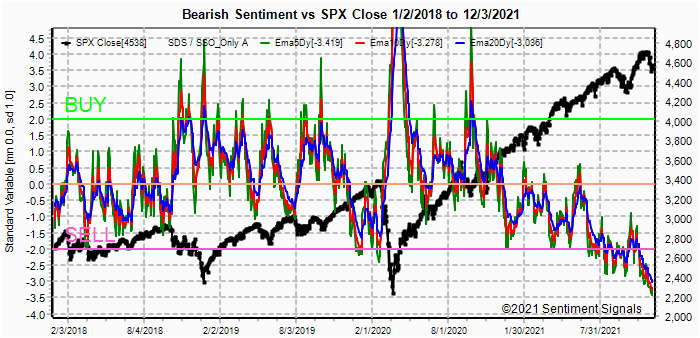
The ST Composite has reached a strong Buy level similar to June 2020, but it remain elevated in June for a couple of weeks before a multi-week rally began.

Here sentiment has reached the highest level of the past year, but similar to June and Sept of 2020 and May 2021 may not see an immediate response.

FOMO sentiment has also jumped strongly.

The longer term EMA (blue) is likely to rise to 1.0 SD before a rally begins.


Update as expected, the HUI fell into the 240-60 trading range.

II. Dumb Money/Smart Money Indicators
This is a new hybrid option/ETF Dumb Money/Smart Money Indicator as a INT/LT term (outlook 2-6 mns) bearish sentiment indicator. The use of ETFs increases the duration (term).
There was a modest pickup in bearish sentiment for the DM/SM indicator, but it remains below that seen in the Sept decline.


III. Options Open Interest
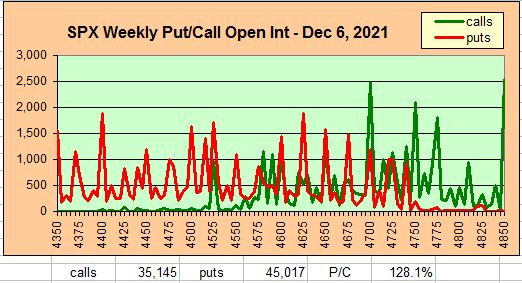
Using Thur closing OI, remember that further out time frames are more likely to change over time, and that closing prices are more likely to be effected. Delta hedging may occur as reinforcement, negative when put support is broken or positive when call resistance is exceeded. This week I will look out thru Dec 10.
With Fri close at SPX 4538, options OI for Mon is very small, but if prices go over light call resistance at SPX 4575 then 4625+ seems likely.


IV. Technical / Other
This week I wanted to take a brief look at the Combined Put-Call Revised indicator (Equity + ETF + SPX), sentiment is very similar to the INT/LT composite with a modest move off Sept lows,.

The VIX Buy&Sell components (VIX/VXV & SKEW) difference is the same as late June where I mentioned that the high SKEW (low sentiment) relative to the VIX term structure was more bullish than bearish.

Conclusions. Overall, sentiment is somewhat of a mixed bag with the strongest case for a ST/INT rally from the Hedge Spread and the VIX Buy&Sell components, options indicators are supportive of the bulls case but may require another week or two to support a rally. The SPX and NDX ETFs are somewhat of a mystery as inflows relative to outflows are increasing, but may be explained by pension fund investing and is likely to be a LT negative.
Weekly Trade Alert. The next week or two are likely to be a basing period, or consolidation near recent lows (4500-4600+) with an Xmas rally possibly from mid-Dec to mid-Jan before the onset of a longer term bear market. Updates @mrktsignals.
Investment Diary, Indicator Primer,
update 2021.07.xx Data Mining Indicators - Update, Summer 2021 (in progress),
update 2020.02.07 Data Mining Indicators,
update 2019.04.27 Stock Buybacks,
update 2018.03.28 Dumb Money/Smart Money Indicators
Article Index 2019 by Topic, completed thru EOY 2020.02.04
Article Index 2018 by Topic
Article Index 2017 by Topic
Article Index 2016 by Topic
Long term forecasts
© 2021 SentimentSignals.blogspot.com
No comments:
Post a Comment