
Last week was expected to show a positive bias thru mid-week with a fizzle by opt exp Fri. The actual result was more volatile than expected with a Tue selloff before a very strong late Wed and early Thur rally to new ATHs and then a strong fizzle thru late Fri with an overall loss of 1%. As noted for several months, I have been expecting more of a rounded top similar to mid-2015 rather than the blow off tops seen since early 2018 and so far Nov & Dec have been a good example with prices ranging between SPX 4500-750. With the recent weakness in retail sales for Nov and the concurrent weakness in the large cap techs leading the NDX, the surprise for 2022 Q1 may be weak EPS that hits the market leaders disproportionately. This fits my outlook for weakness in the averages starting with the mid-Jan earnings season.
Sentiment indicators are starting to turn down but remain well above the Sell level, so several more weeks of directionless trading are likely ahead. The implications of last weeks late selloff are unclear, but in Tech/Other a chart of the SPX for 2015 Q4 shows similar behavior before the Jan selloff. A look at the VIX Buy&Sell components is included.
I. Sentiment Indicators
The INT/LT Composite indicator (outlook 3 to 6+ months) has three separate components. 1st is the SPX and ETF put-call indicators (30%), 2nd the SPX 2X ETF INT ratio (40%), and 3rd a volatility indicator (30%) which combines the options volatility ratio of the ST SPX (VIX) to the ST VIX (VVIX) with the VXX $ volume.
The INT/LT Composite indicator continues a pattern somewhat similar to early 2020 where a modest uptick in bearish sentiment occurred with the Jan pullback and a higher low in sentiment was seen before a larger top.

Here, a sharp drop in ST sentiment occurred thru Wed before rallying back above neutral Thur-Fri.
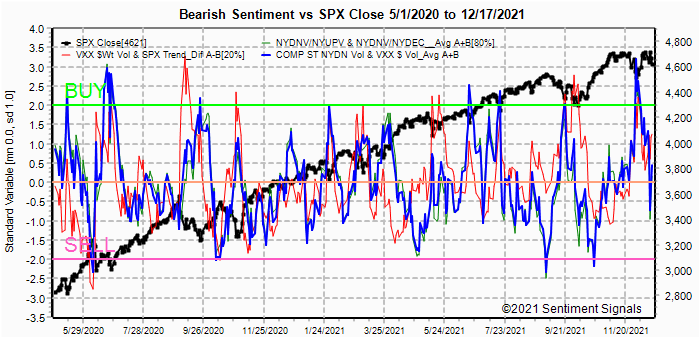
Here, bearish sentiment remains elevated (due to FOMO and hedging), and indicates several weeks of positive bias are likely before a larger decline.

The faster EMAs are showing weakening sentiment.

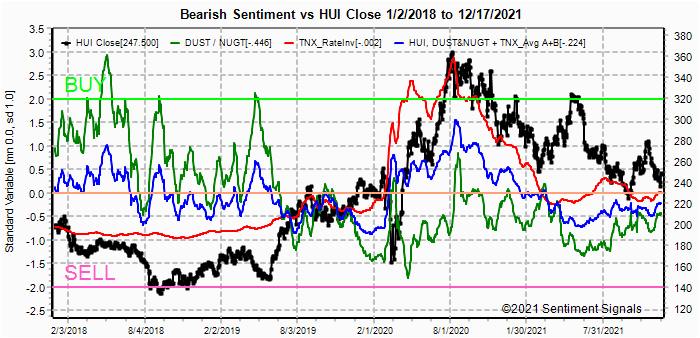
As expected, the HUI bounced from just below the 240 support level, and a modest increase in bearish sentiment supports more gains.
II. Dumb Money/Smart Money Indicators
This is a new hybrid option/ETF Dumb Money/Smart Money Indicator as a INT/LT term (outlook 2-6 mns) bearish sentiment indicator. The use of ETFs increases the duration (term).
Similar to the INT/LT Composite, sentiment may be following the path seen in early 2020 where the extreme lows were seen several months before the final top with the recent rise similar to the Jan 2020 pullback. This favors several weeks more of positive bias.


III. Options Open Interest
Using Thur closing OI, remember that further out time frames are more likely to change over time, and that closing prices are more likely to be effected. Delta hedging may occur as reinforcement, negative when put support is broken or positive when call resistance is exceeded. This week I will look out thru Dec 23 and EOM.
With Fri close at SPX 4621, options OI for Mon is very small and put support up to 4700 could contribute to a rally back toward the SPX 4675-4700 area.


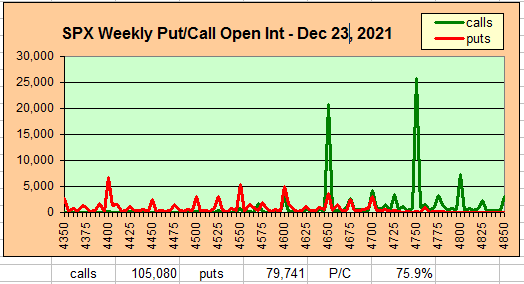
For EOM large OI at lower levels below 4500 may be skewing the overall P/C and should be ignored unless the SPX drops below 4550. Otherwise, the range of 4650-4700 seems most likely.

IV. Technical / Other
Typically, EOQ or quad-witch options exp are considered accumulation when down and distribution when up (as Sept 2018) due to high volume, but occasionally they are not, eg, Dec 18, 2015. In 2015, we also saw a (lower) high in Nov that had a failed retest opt exp week with a sharp two day selloff into exp Fri, then a slightly higher high two weeks later before a larger selloff.

Otherwise, I wanted to take a look at some of the volatility measures, starting with the VIX Buy&Sell. The lows may be in during July-Aug several months before the top as seen in late 2019-early 2020.
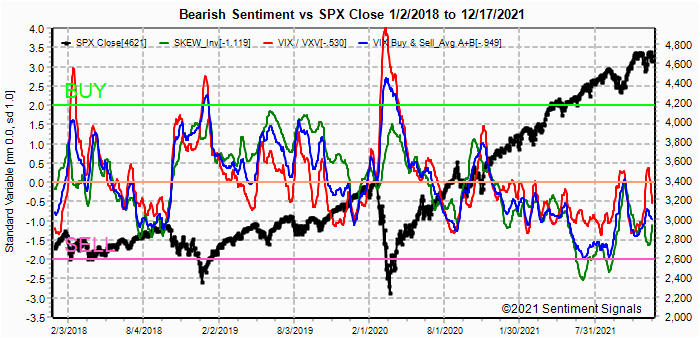
Looking at VIX components as diffs, the positive spread between the sentiment for the SKEW vs VIX/VXV has dropped sharply and is nearing levels seen before the Sept selloff.

Conclusions. As someone once said, "bottoms are an event and tops are a process." The question remains for many as to whether the markets are building a base for further upside as many were expecting in 2015, or is market behavior indicating distribution as smart money sells to the less knowledgable. As now the worlds richest man and likely one of the smartest, E. Musk has recently sold over $10B in Tesla shares, so I think the vote is in.
Weekly Trade Alert. I haven't given much directional advice recently and the markets recent behavior of turning on a dime shows why. About all I'm willing to say is enjoy the holidays and wait for a better opportunity. Updates @mrktsignals.
Investment Diary, Indicator Primer,
update 2021.07.xx Data Mining Indicators - Update, Summer 2021 (in progress),
update 2020.02.07 Data Mining Indicators,
update 2019.04.27 Stock Buybacks,
update 2018.03.28 Dumb Money/Smart Money Indicators
Article Index 2019 by Topic, completed thru EOY 2020.02.04
Article Index 2018 by Topic
Article Index 2017 by Topic
Article Index 2016 by Topic
Long term forecasts
© 2021 SentimentSignals.blogspot.com
No comments:
Post a Comment