
Last weeks Bradley turn date on the 15th turned out to be a bust as a major turn as neither top or bottom were indicated after several months of correct calls, Some weakness was expected early as "weak" Sells were indicated by the ST and ST/INT composites and a sizable decline was indicated by the DM/SM indicator, but the continued strength in inflation was a surprise and caused a drop into the mid SPX 3700s before a late rebound. With ST & INT indicators back to neutral, a move back to SPX 3950 by EOW is possible, but a brewing Sell from the VIX Call indicator (Tech/Other) indicates another pullback is likely later.
The hybrid SPX ETF/option indicator is included in the INT/LT Composite indicator by setting both to equal wts, and in the DM/SM section a hybrid indicator for the NDX is introduced using the ETF options as a proxy for QQQ options.
I. Sentiment Indicators
The INT/LT Composite indicator (outlook 3 to 6+ months) has three separate components. 1st is the SPX and ETF put-call indicators (30%), 2nd the SPX 2X ETF INT ratio (40%), and 3rd a volatility indicator (30%) which combines the options volatility ratio of the ST SPX (VIX) to the ST VIX (VVIX) with the UVXY $ volume.
Update Alt. In this case the wts for the SPX 2X ETF ratio (SDS/SSO) and SPX puts & calls spread are adj to equal as in the DM/SM section for SPX ETFs. Here, the extremes between the SPX options and 2X ETFs offset, resulting in a near-neutral sentiment reading and likely to result in a choppy market with limited upside and downside.


Update. 10 day SMA is near neutral.

Update EMA. Last weeks weak Sell generated a larger than expected decline aided by the surprise CPI on Wed, but now has a slightly stronger "weak" Buy that may mean a vst move over 3900 (3950 by Fri with SPX options OI).

Update EMA. The negative reading from last week has reversed back to neutral.


Update. Component view shows bearish ETF sentiment continuing to rise and may result in an extended trading range similar to the last half of 2019. HUI is about 8X GDX.

II. Dumb Money/Smart Money Indicators
This is a new hybrid option/ETF Dumb Money/Smart Money Indicator as a INT/LT term (outlook 2-6 mns) bearish sentiment indicator. The use of ETFs increases the duration (term).
Update. This indicator warned of a possible sizable drop last week, but now back to neutral.


For the NDX combining the hybird ETF options plus NDX 3X ETF sentiment with the interest rate effect, (outlook 2 to 4 mns) bearish sentiment shows similar extremes between ETF and options as in late 2020 which resulted in a choppy market until options sentiment rose. Note QQQ options are optimal, but are N/A and are included in ETF options.

III. Options Open Interest
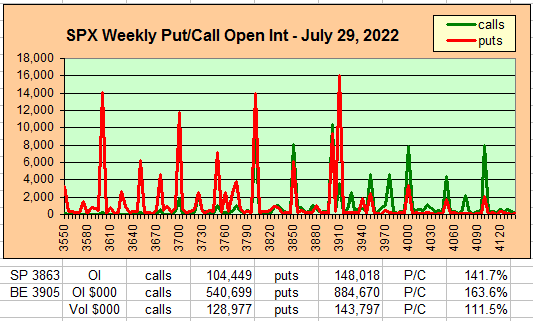
Using Thur closing OI, remember that further out time frames are more likely to change over time, and that closing prices are more likely to be effected. Delta hedging may occur as reinforcement, negative when put support is broken or positive when call resistance is exceeded. This week I will look out thru July 2. A text overlay is used for extreme OI to improve readability, P/C is not changed. A new addition is added for OI $ amounts with breakeven pts (BE) where call & put $ amounts cross plus $ volume.
With Fri close at SPX 3863, options OI for Mon is very small with no real put support to 3800. The straddle at 3850 has a negative bias. so some weakness is expected with the close likely between 3840-60.


For Fri 29th EOM strong put support extends up to SPX 3910, above that is uncertain.
IV. Technical / Other
This week I wanted to take a brief look at the VIX Call indicator which is approaching but not quite at a Sell. .

Conclusions. Already many of the Wall St banks are talking about the Fed reversing course by the EOY and possibly cutting rates by mid-2023 mostly due to a slow down in consumer spending and the resultant weakness in GDP (70%& consumer spending). But as I have discussed before consumer behavior the last two years has been anything but normal due to the trillions in government handouts that have probably inflated GDP by 10% or more, and I don't think the Fed is willing to "do whatever it takes" to keep the party going as long as inflation is rampant. A monumental hangover is more likely.
Weekly Trade Alert. Some EW analysts are looking for a ST move over SPX 3950 before a retest of the June lows at 3640, but with most indicators at or above neutral, the summer doldrums, or a trading range, seems more likely. Updates @mrktsignals.
Investment Diary, Indicator Primer, Tech/Other Refs,
update 2021.07.xx Data Mining Indicators - Update, Summer 2021,
update 2020.02.07 Data Mining Indicators,
update 2019.04.27 Stock Buybacks,
update 2018.03.28 Dumb Money/Smart Money Indicators
Article Index 2019 by Topic, completed thru EOY 2020.02.04
Article Index 2018 by Topic
Article Index 2017 by Topic
Article Index 2016 by Topic
Long term forecasts
© 2022 SentimentSignals.blogspot.com
No comments:
Post a Comment