
A continuation of the summer rally was expected last week after some initial weakness and more or less followed expectations with up then down days Mon & Fri, while Tue-Thur rallied with a gain of about 3% for the week. Other CBs are following the Fed with the EU making a "surprise" 0.5% hike (now 0% after being negative for 8 yrs) that seemed to spark a rally in risk assets as the US $ fell. Next weeks FOMC may see a similar positive response as markets seem to be on an "Alice in Wonderland" mood where higher rates now mean lower rates later.
Overall sentiment seems to be moving toward the Sell side, but the recent move in the SPX above the 50D SMA (3920) is likely to provide ST support and similar occurrences in Feb and June saw two week trading ranges.of about 150 pts (Feb/above, June below) before a continuation of the decline. Two important considerations for the INT are the concerns over capitulation and recession. This week in the Tech/Other section, I examine a couple of very LT indicators that show capitulation may be high compared to the "easy money" period of 2018-22 but not to normal periods since 2000. An update of the ST VIX call indicator is included. Next week, I will examine some recession possibilities.
I. Sentiment Indicators
The INT/LT Composite indicator (outlook 3 to 6+ months) has three separate components. 1st is the SPX and ETF put-call indicators (30%), 2nd the SPX 2X ETF INT ratio (40%), and 3rd a volatility indicator (30%) which combines the options volatility ratio of the ST SPX (VIX) to the ST VIX (VVIX) with the UVXY $ volume.
Update Alt. In this case the wts for the SPX 2X ETF ratio (SDS/SSO) and SPX puts & calls spread are adj to equal as in the DM/SM section for SPX ETFs. Volatility sentiment continues to be modestly positive, while SPX ETF vs options sentiment remains at opposite extremes.


Update. ST sentiment dropped to the early June level where a two week consolidation was seen before continuation of the decline.

Update EMA. A sharp decline in sentiment Wed/Thur on the SPX move over 3950 may be following the pattern of early June.

Update EMA. This indicator is quickly approaching levels seen at the Apr-May and June SPX highs.


Update. Bearish sentiment continues to rise.

II. Dumb Money/Smart Money Indicators
This is a new hybrid option/ETF Dumb Money/Smart Money Indicator as a INT/LT term (outlook 2-6 mns) bearish sentiment indicator. The use of ETFs increases the duration (term).
Update. Easily the most bearish INT indicator, this indicator is quickly approaching the Sell level, now at the lowest level since the Jan decline.


Update. Bearish sentiment rose with the late pullback, now nearing a Buy.

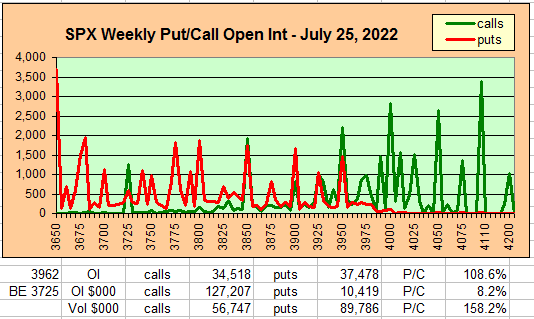
III. Options Open Interest
Using Thur closing OI, remember that further out time frames are more likely to change over time, and that closing prices are more likely to be effected. Delta hedging may occur as reinforcement, negative when put support is broken or positive when call resistance is exceeded. This week I will look out thru July 29. A text overlay is used for extreme OI to improve readability, P/C is not changed. Also, this week includes a look at the GDX for Aug exp & TLT for Sept. A new addition is added for OI $ amounts with breakeven pts (BE) where call & put $ amounts cross plus $ volume.
With Fri close at SPX 3962, options OI for Mon is very small and straddles at 3925 and 3950 may contain prices.


Using the GDX as a gold miner proxy closing at 25.4, there is strong put support at 25 and the large straddle at 28 may attract prices to the 27-8 area..

Currently the TLT is 118.5 with the TNX at 2.78%, early in the year I noted that large put positions contra to ETF sentiment may be "smart" money and this may be the same for calls. TLT 120 is about TNX 2.75% and 125 about 2.5%.

IV. Technical / Other
First a quick update of the ST VIX call indicator shows continued movement toward the Sell level and volatility may continue to rise.

Next, I use the NY down volume/declining issues as a measure of capitulation (NYDNV/NYDEC). and looking at the last 5 years, it matched the highs seen in early 2018, but when compared to the period since 2000, we see that it also matches the SPX 2001 low about half way thru the 2000-02 bear market. In both cases, there is also a larger trend upwards from the mid 1990s and mid 2010s.

A second LT indicator of positive money. flows is the NYUPV/NYDEC or NY volume advancing to declining. Here, we strong money flows similar to that off the Dec 2018 lows. However, from a historical perspective the more relevant comparison may be the first half of 2008. In this case after surviving the Covid pandemic and the resulting stock market performance, retail investors feel invincible (with most not even aware of what it was like during the inflationary 1970s), while in the first half of 2008, investors had lived thru the dot-com crash and 2002s 09/11 terrorist attack and also felt invincible.

Conclusions. The summer rally may be nearing a close with the possibility of extending thru early Aug. Its now looking like the following correction may extend into Sept with the expected relief from lower inflation being delayed. ST accelerated inflation likely in food supplies due to recent drought and extreme heat extending into the Fall may offset the effects of lower fuel prices. ST/INT sentiment is aligning for a sizeable pullback, possibly to retest the June lows (SPX 3640), but a couple of weeks of upside momentum is likely to persist as long as the SPX remains above the 50D SMA at 3920.
Weekly Trade Alert. A trading range of about 150 SPX pts (3925-4075) is expected thru the first week Aug. Some weakness to SPX 3925-3950 may be seen early in the week but a test of 4000+ is likely by Fri. FOMC on Wed and APPL EPS on Thur may result in large moves. Updates @mrktsignals.
Investment Diary, Indicator Primer, Tech/Other Refs,
update 2021.07.xx Data Mining Indicators - Update, Summer 2021,
update 2020.02.07 Data Mining Indicators,
update 2019.04.27 Stock Buybacks,
update 2018.03.28 Dumb Money/Smart Money Indicators
Article Index 2019 by Topic, completed thru EOY 2020.02.04
Article Index 2018 by Topic
Article Index 2017 by Topic
Article Index 2016 by Topic
Long term forecasts
© 2022 SentimentSignals.blogspot.com
No comments:
Post a Comment