
Another volatile week where I correctly identified the market pulse (direction, but not the amounts as a rally was expected to start the week then completely retrace by Friday's open. However, instead of the meager rally to SPX 4000+, we saw a moonshoot with the Tue open after a tamer CPI to 4100 before closing near the expected level at 4020. Wed's slugfest from the FOMC Fri afternoon began a sharp retracement toward the SPX OI BE at 3930, then continued to fall Thur and Fri, breaking near the EOQ target at 3835 (act 3828). It now appears likely that the SPX will continue to waffle around current levels or lower into mid-Jan when earnings are released and it's very likely that the Nov 10 CPI release gap at SPX 3750 is filled at some time. Another good CPI in Jan may also re-awaken the bulls and it's possible with the late Jan FOMC rate huke, (Jan31-Feb 1) the Fed starts discussng a "pause".
This weeks Tech/Other takes a closer look at the consensus for 2023 which is a decline in H1 to about SPX 3000 and a year end rally back to the mid-4000s and why I disagree.
I. Sentiment Indicators
The INT/LT Composite indicator (outlook 3 to 6+ months) has three separate components. 1st is the SPX and ETF put-call indicators (30%), 2nd the SPX 2X ETF INT ratio (40%), and 3rd a volatility indicator (30%) which combines the options volatility ratio of the ST SPX (VIX) to the ST VIX (VVIX) with the UVXY $ volume.
Update Alt. In this case the wts for the SPX 2X ETF ratio (SDS/SSO) and SPX puts & calls spread are adj to equal as in the DM/SM section for SPX ETFs. Bearish sentiment continues to hover near recent lows while options sentiment is at extreme lows and SPX ETF and vol sentiment remain near neutral.


Update. Here, sentiment has moved from a weak Sell (-1SD) to a weak Buy, supporting a modest rally.

Update EMA. The ST strength of the decline has pushed sentiment higher and may indicate a rally next week before renewed weakness at EOY.

The ST VIX Call & SPXADP indicator. Sentiment is slightly higher than at the beginning of last week.

Update EMA. A strong increase in hedging has pushed ST sentiment to near the highest levels of the year.


Update. Bearish ETF sentiment continues to fall and the implications from 2018 are that a plunge to 2018 lows may be seen in 2023.

II. Dumb Money/Smart Money Indicators
This is a new hybrid option/ETF Dumb Money/Smart Money Indicator as a INT/LT term (outlook 2-6 mns) bearish sentiment indicator. The use of ETFs increases the duration (term).
Update. The extreme low bearish levels continue to highlight the fragile state of the market.


Update. A rebound in ETF options sentiment has helped
push overall sentiment back to neutral.

III. Options Open Interest
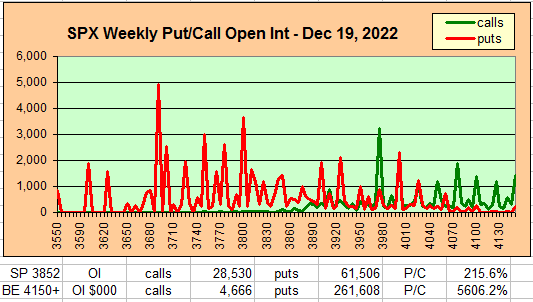
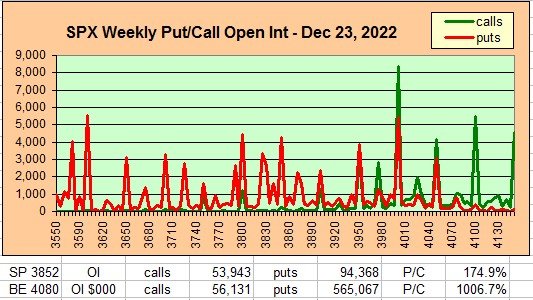
Using Thur closing OI, remember that further out time frames are more likely to change over time, and that closing prices are more likely to be effected. Delta hedging may occur as reinforcement, negative when put support is broken or positive when call resistance is exceeded. This week I will look out thru Dec 23. A text overlay is used for extreme OI to improve readability, P/C is not changed. Also, this week includes a look at the GDX for Dec exp. A new addition is added for OI $ amounts with breakeven pts (BE) where call & put $ amounts cross.
With Fri close at SPX 3852, options OI for Mon is very small where strong put support is at 3800 and call resistance is at 3980. Further downside is possible with a range of 3800-3900.


IV. Technical / Other
You may have noticed that almost all analysts are predicting a bear market low in 2023H1 simiilar to 2008-09 with a strong rebound in the second half with lows near 3000 and an EOY target in mid-4000s. This includes Wall Street and prominent EW analysts (Trader Joe and Pretzel). As a contrarian I have to question whether the majority is right, although sometimes negative sentiment can be overwhelming, more often than not, the main effect is lop-sided positioning as shown in the extreme Hedge Spread indicator that results in the unexpected.
In part, I think this is due the logic shown by
PNB Paribas, where
they looked at 100 years of stock market crashes and found an average length of
bear markets of 17 mns, declines of 38% and VIX > 40. So their conclusion
was that this one will end by June with the SPX near 3000. The math,
however, mis-uses the concept of an average which is the mean of a number of
occurences. Looking at the 4 bear markets since 2020 (Mar 2020-Oct 2022,
Oct 2007-Mar 2009, Oct-Dec 2018, Feb-Mar 2020) the mean is 13 months and to
bring the average up to 17 this one needs to be almost three years.
There is a long-standing adage in macro economics that monetary policy acts with
a highly variable lag of 6 to 9 months. The following is a chart of the
Fed rate hikes in 2023 taken from the NY Fed.
It's hard for me to see any Fed Funds rate less that 3% as being restrictive to
the economy and that rate was not achieved until Sept, so 6 to 9 mns later is
Apr-June which is when problems should begin to appear. So, I may be wrong
but mid to late 2023 looks more dangerous to me.

Conclusions. Time is running short so I am going to be concise. The extreme moves we saw last week may be symtomatic of the extremely disjointed sentiment with day trading options players mostly bullish which is offset by bearish hedging extremes. I guess this kind of distortion in how markets are supposed to work is a result of central bank meddling and is likely to continue for several more years. The last couple of weeks I have pointed to the large SPX call position at 3835 Dec 30 as a possible target for dealers who were facing massive losses and has probably caused the relentless selling on days where there are no major news events. Lows could extend to the SPX 3750 gap fill from the Nov 10 CPI blast off and backing and filling may continue into mid-Jan.
Weekly Trade Alert. Next week looks to positive after some early weakness toward SPX 3800 with upside potential of 3900-50 before a late Dec selloff. Updates @mrktsignals.
Investment Diary, Indicator Primer, Tech/Other Refs,
update 2021.07.xx Data Mining Indicators - Update, Summer 2021,
update 2020.02.07 Data Mining Indicators,
update 2019.04.27 Stock Buybacks,
update 2018.03.28 Dumb Money/Smart Money Indicators
Article Index 2019 by Topic, completed thru EOY 2020.02.04
Article Index 2018 by Topic
Article Index 2017 by Topic
Article Index 2016 by Topic
Long term forecasts
© 2022 SentimentSignals.blogspot.com
No comments:
Post a Comment