
The last two to three weeks I have been expecting an important ST inflection with the NVDA EPS May 22 after the blowout results in Feb which preceded a 200 pt SPX rally thru Mar. This time, however, the SPX had already rallied 300 pts in May aided by the "Sell in May" bears and the results were mainly as expected with a weekly target of 5250-5300 but a somewhat higher high than expected at 5340 then a low at 5256, all on the 22nd. Many of the EW analysts were looking for a wave pullback to SPX 5240-50 before a wave 5 to about 5400, then a 10%+ decline. Stubbornly, I am still sticking to my rounded top scenario with more range trading before a larger decline. This weeks Tech/Other section looks more closely at this scenario via the May 2015 analog.
Sentiment this week remains moderately bearish with only the ST Composite moving to a weak Buy, while the Hedge Spread only improved to neutral. I was looking for a 70-80% retrace of the decline, or SPX 5310-20, before further downside. The May 2015 analog implies a consolidation next week with a range of about SPX 5270-5320 before further downside into the June 7 jobs report. Tech/Other looks at initial claims as a possible leading indicator. Wed June 12 is another possible important date with CPI in the AM and FOMC in the PM. Strong data/hawkish Fed increases the potential for SPX 5075-100 by late June early July. PCE is this Fri.
Last weeks COT data showed a weak Sell on the DJIA (YM), which proved timely, and this week the NDX (NQ) joins in.
I. Sentiment Indicators
The INT/LT Composite indicator (outlook 3 to 6+ months) has three separate components. Starting Aug 26, 2023 SPX options are removed due to extreme 0DTE volume distortions. New weights are ETF put-call indicator (30%), SPX 2X ETF INT ratio (40%), and 3rd a volatility indicator (30%) which combines the options volatility spread of the ST SPX (VIX) to the ST VIX (VVIX) with the UVXY $ volume.
Update Alt. Bearish sentiment improved from a weak Sell, but remains below neutral.


Update. Bearish sentiment improved from just above a weak Sell to just below a weak Buy.


Update EMA. Bearish sentiment moved up strongly from a strong Sell, but remains below neutral.


Update. Bearish sentiment remains near the weak Buy.

II. Dumb Money/Smart Money Indicators
This is a new hybrid option/ETF Dumb Money/Smart Money Indicator as a INT/LT term (outlook 2-6 mns) bearish sentiment indicator. The use of ETFs increases the duration (term).
Update. Bearish sentiment improved but remains near the weak Sell.


For the SPX, I am switching to hybrid 2X ETFs plus SPX options. Taking a look at the
INT term composite (outlook 2 to 4 mns), bearish sentiment continues to
decline.

Bearish sentiment moved down to below a weak Sell.

Bearish sentiment for SPX is below neutral.

III. Options Open Interest
Using Thur closing OI, remember that further out time frames are more likely to change over time, and that closing prices are more likely to be effected. Delta hedging may occur as reinforcement, negative when put support is broken or positive when call resistance is exceeded. This week I will look out thru May 31. A text overlay is used for extreme OI to improve readability, P/C is not changed. A new addition is added for OI $ amounts with breakeven pts (BE) where call & put $ amounts cross.
With Fri close at SPX 5305 and Mon holiday, options OI for Tue is moderate but shows little bias between 5200 and 5350.


IV. Technical / Other
This week I want to review the May 2015 rounded top. Previously I was expecting a 1 mn lag with May 2024 = Apr 2015 with a spike for NVDA EPS (red circle) within a downtrend, but as it turns out the weekly range over 5300 was more like May 2015 (grn circle). This implies a consolidation (possibly a triangle) before more downside, likely in early June. Possible lower inflections could be at/near the June 7 jobs report and CPI/FOMC on the 12th.

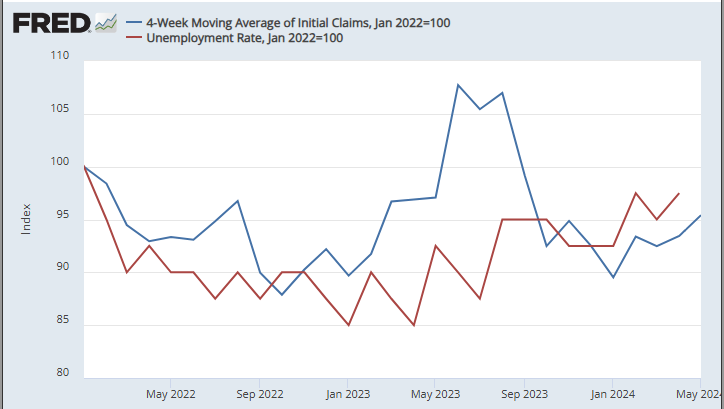
Looking for clues as to where the jobs data for May June 7. I looked at the 4 wk MA of the weekly jobless claims vs the unempl rate (indexed to 100). As of Jan 2022 the unempl rate was 4% and the initial claims MA was 240k. There appears to be about a 1-mn lag. The 1st two weeks of May the IC weekly was 225k, but last week dropped to 215k. If next week (Wed) the IC are 215k or lower, a strong jobs report is likely, but if 225k or over then a week report is more likely.
In last weeks update, I posted this update of the LT NY Adv/Dec volume which shows that as strong as the market appears price-wise, volume support is quickly diminishing although an INT top may still be months away.

The following uses barcharts.com as a source and discusses S&P futures (ES) as a third venue of stock sentiment in addition to options and ETFs. The non-commercial/commercial spread represents a LT bearish sentiment (dumb money/smart money) indicator. As explained in investopedia, commercial investors (red) are institutions and are smart money, while non-commercials (green) are speculators such as hedge funds and are dumb money. Here is the current barchart graph for the S&P 500 (top) and trader positions (1st bot) with positives as net longs and negatives as net shorts. Bearish sentiment is represented by the spread and is positive if red > green (Buy) and negative if green > red (Sell). ES (SPX) sentiment is neutral at -0.10 SD, NQ (NDX) is at a weak Sell -1.0 SD, YM (DJIA) remains a weak Sell at -1.25 SD, Dow theory no longer supports DJIA.
Click dropdown list to select from the following options:
Tech / Other History2024
2023
2022
Other Indicators
Conclusions. So far, so good. I will admit that I have underestimated the markets strength as "the powers that be" seem to be willing to do "whatever it takes" to keep the bears at bay before the election to help "sleepy Joe". It somewhat reminds me of the summer of 2008 with Ben Bernanke's "the subprime problem is well-contained" speech. To be realistic, I give the EW w4 to SPX 5250ish then w5 to 5390ish a 40% probability and a more extended top a 60% for now.
Weekly Trade Alert. Next week is expected to be a prelude, but to what? Looking for a range of SPX 5270-5320, possibly a triangle. Updates @mrktsignals.
Investment Diary,
Indicator Primer,
Tech/Other Refs,
update 2021.07.xx
Data Mining Indicators - Update, Summer 2021,
update 2020.02.07 Data Mining Indicators,
update 2019.04.27 Stock Buybacks,
update 2018.03.28 Dumb Money/Smart Money Indicators
Article Index 2019 by Topic, completed thru EOY 2020.02.04
Article Index 2018 by Topic
Article Index 2017 by Topic
Article Index 2016 by Topic
Long term forecasts
© 2024 SentimentSignals.blogspot.com
No comments:
Post a Comment