
Last week started out much as expected with the Tue open at SPX 5316, near the top of the expected range (5270-5320), and Wed closed near the bottom at 5267 based on weak 2, 5 and 7-year T-bond auctions with weak foreign demand. An interesting article at ZH a couple of weeks ago discussed how Japan holds its reserves in US T-bonds, and to support its currency sells T-bonds to buy yen. Last week they bought $62B yen with little success, so US bond demand may continue to be weak. For both Thur and Fri more problems surfaced in AI-related stocks with Thur disappointing outlook from SalesForce (CRM, a heavy AI user) which fell 20% and Fri from Dell (AI servers) which fell 25% after tripling in 2024. As a result the SPX continued to fall sharply to a low of 5191 on Fri AM. The Trump trial was finally concluded and went to jury Thur. As it turns out the Trump trial was the likely culprit of much of the decline Thur-Fri over concern of the verdict and its effect since the SPX began to rally shortly after the verdict Fri late AM, and subsequently reversed all losses by the close at 5278. The verdict that mattered was that his supporters did not seem to care and to the markets, the tax outlook for Biden (higher) and Trump (lower) was all that mattered. The next big test will be sentencing, scheduled for July 11, which just happens to coincide with my expected low of SPX 5075-5100 by mid-July before a summer rally.
Sentiment indicators this week paint a mixed picture. The ST Composite (SMA) and VIX/SPXADP Indicator both moved to a weak Buy, but other INT indicators such as Hedge Spread and other ETF and options indicators remain at/below neutral. SPX options OI for Fri shows the potential for a move to SPX 5325-50 which is supported by last weeks initial jobless claims increase with the highest 4 wk MA since last Sept. Last weeks Tech/Other discussed how higher initial claims may indicate a weak jobs report which could help Fed rate cut hopes
I. Sentiment Indicators
The INT/LT Composite indicator (outlook 3 to 6+ months) has three separate components. Starting Aug 26, 2023 SPX options are removed due to extreme 0DTE volume distortions. New weights are ETF put-call indicator (30%), SPX 2X ETF INT ratio (40%), and 3rd a volatility indicator (30%) which combines the options volatility spread of the ST SPX (VIX) to the ST VIX (VVIX) with the UVXY $ volume.
Update Alt. Bearish sentiment remains below neutral.
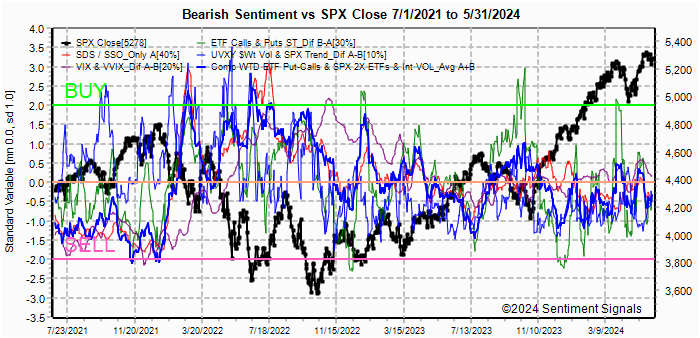

Update. Bearish sentiment moved up to a weak Buy.


Update EMA. Bearish sentiment continued to improve, but remains near neutral.


Update. Bearish sentiment ETF sentiment increased back to a strong Buy with overall sentiment at +1.5 SD.

II. Dumb Money/Smart Money Indicators
This is a new hybrid option/ETF Dumb Money/Smart Money Indicator as a INT/LT term (outlook 2-6 mns) bearish sentiment indicator. The use of ETFs increases the duration (term).
Update. Bearish sentiment improved from a weak Sell to almost neutral.


For the SPX, I am switching to hybrid 2X ETFs plus SPX options. Taking a look at the INT term composite (outlook 2 to 4 mns), bearish sentiment remains near a weak Sell.

Bearish sentiment remains at a weak Sell.

Bearish sentiment for SPX remains below neutral.

III. Options Open Interest
Using Thur closing OI, remember that further out time frames are more likely to change over time, and that closing prices are more likely to be effected. Delta hedging may occur as reinforcement, negative when put support is broken or positive when call resistance is exceeded. This week I will look out thru June 7. A text overlay is used for extreme OI to improve readability, P/C is not changed. A new addition is added for OI $ amounts with breakeven pts (BE) where call & put $ amounts cross.
With Fri close at SPX 5278, options OI for Mon is moderate with put support up to 5275 and call resistance at 5350. Weak put support at 5275 and the large straddle at 5300 should give a positive bias.


IV. Technical / Other
The following uses barcharts.com as a source and discusses S&P futures (ES) as a third venue of stock sentiment in addition to options and ETFs. The non-commercial/commercial spread represents a LT bearish sentiment (dumb money/smart money) indicator. As explained in investopedia, commercial investors (red) are institutions and are smart money, while non-commercials (green) are speculators such as hedge funds and are dumb money. Here is the current barchart graph for the S&P 500 (top) and trader positions (1st bot) with positives as net longs and negatives as net shorts. Bearish sentiment is represented by the spread and is positive if red > green (Buy) and negative if green > red (Sell). ES (SPX) sentiment is neutral at -0.2 SD, NQ (NDX) is at a weak neutral -0.5 SD, YM (DJIA) remains a weak Sell at -1.0 SD, Dow theory no longer supports DJIA.
Click dropdown list to select from the following options:
Tech / Other History2024
2023
2022
Other Indicators
Conclusions. Although much of last weeks turmoil can be blamed on
the uncertainty regarding the outcome of Trump's "hush money" trial and the
future of the 2024 election and the effect on taxes for the next few years, a
disturbing trend is beginning to develop for the AI sector. In Apr,
AMSL (the largest producer of equipment to make semiconductors) fell 10% in 1
day with weaker earnings outlook and the same happened to TMSC (the
largest producer of semiconductors for AI) . Last week on Thur, SalesForce
(CSM, a major user of AI to support corp customer relations reported disappointing results and fell 20% in 1
day, and on Fri DELL (a major player in AI servers) disappoints and fell 25% in 1 day.
Combine this with the recent Google AI fiasco and you begin to wonder if "the AI emperor
has no clothes".
Weekly Trade Alert. The markets may start out slow (SPX 5275-5300),
but recent economic data may point to a weak Fri jobs report supporting a dovish
Fed and a move to SPX 5325-50. Updates @mrktsignals.
Investment Diary,
Indicator Primer,
Tech/Other Refs,
update 2021.07.xx
Data Mining Indicators - Update, Summer 2021,
update 2020.02.07 Data Mining Indicators,
update 2019.04.27 Stock Buybacks,
update 2018.03.28 Dumb Money/Smart Money Indicators
Article Index 2019 by Topic, completed thru EOY 2020.02.04
Article Index 2018 by Topic
Article Index 2017 by Topic
Article Index 2016 by Topic
Long term forecasts
© 2024 SentimentSignals.blogspot.com
No comments:
Post a Comment