Expectations were for a relatively calm week (SPX 5450-5500) with the
potential for a pop and drop next week with both CPI and Trumps sentencing in
the "hush money" trial providing the final push higher, but after a weak opening Mon
down to SPX 5445 and a recovery to 5475, the Supreme Court issued a surprise
"blanket immunity" decision for Trumps "Presidential immunity" appeal.
This was followed by the judge in the "hush money" trial delaying sentencing for
two months with the view that this case and others against Trump would face
serious headwinds and may even be thrown out or delayed until after the
election. The best source discussing the decision that I saw was here.
As a result, Tue-Fri saw a steady advance of almost 2% for the SPX and more for
NDX as Trumps Nov victory is almost assured.
Overall sentiment remains rather benign. The ST Composite remains near
the weak Buy level although the VST EMA indicates a one-two day pullback is
likely soon. The SPX ETF and SPX option dumb money indicator continues to
improve over neutral.
I. Sentiment Indicators
The INT/LT Composite indicator (outlook 3 to 6+ months) has three separate
components. Starting Aug 26, 2023 SPX options are removed due to extreme 0DTE volume
distortions. New weights are ETF put-call indicator (30%), SPX 2X ETF INT
ratio (40%), and 3rd a volatility indicator (30%) which combines the options
volatility spread of the ST SPX (VIX) to the ST VIX (VVIX) with the UVXY $ volume.
Update Alt, INT view. Bearish sentiment improved slightly but remains below
neutral.
Update Alt EMA. Bearish sentiment improved to neutral.
The ST Composite as a ST (1-4 week) indicator includes the NYSE volume ratio
indicator (NYDNV/NYUPV & NYDNV/NYDEC) and the UVXY $ Vol/[SPX Trend, SMA only]. Weights
are 80%/20%.
Update. Bearish sentiment improved slightly.
Update EMA. Bearish sentiment VST (grn) declined sharply at EOW.
The ST VIX calls and SPXADP indicator bearish sentiment remains just below
neutral.
The ST/INT Composite indicator (outlook 1 to 3 months) is based on the Hedge Spread (48%)
and includes ST Composite (12%) and three options FOMO indicators using SPX (12%),
ETF (12%), and Equity (12%) calls compared to the NY ADV/DEC issues (inverted). FOMO
is shown when strong call volume is combined with strong NY ADV/DEC. See
Investment Diary
addition for full discussion.
Update EMA. Bearish sentiment declined sharply from just below neutral to a
weak Sell.
Bonds (TNX). Bearish sentiment remains at low extremes.
For the INT outlook, the gold miners (HUI) bearish
sentiment is presented in a new format using the data mining software to add
the inverse TNX rate to the ETF ratio.
Update. Bearish sentiment from ETFs remains strong, keeping overall
sentiment at a weak Buy level.
II. Dumb Money/Smart Money Indicators
This is a new hybrid option/ETF Dumb Money/Smart Money Indicator as a INT/LT
term (outlook 2-6 mns) bearish sentiment indicator. The use of ETFs
increases the duration (term).
Update. Bearish sentiment declined back to the weak Sell level.
With the sister options Hedge Spread as a ST/INT indicator
(outlook 1-3 mns), bearish sentiment bounced early in the weak then fell to
recent lows at EOW.
A new composite SPX options indicator uses both the volume adj (1/B-A) and P/C
equivalent spread (A-B) to compensate for the discrepancy between the two.
This replaces the old SPX options indicator for the SPX ETFs + options below and the
INT/LT composite. No chart.
For the SPX, I am switching to hybrid 2X ETFs plus SPX options. Taking a look at the
INT term composite (outlook 2 to 4 mns), bearish sentiment continues to
improve as SPX ETFs and options positions are increasingly bearish.
For the NDX combining the hybrid ETF options plus NDX 3X ETF sentiment with the interest rate effect,
(outlook 2 to 4 mns) bearish sentiment shows similar extremes between ETF and
options as in late 2020 which resulted in a choppy market until options
sentiment rose. Note QQQ options are optimal, but are N/A and are included
in ETF options.
Bearish sentiment remains below a weak Sell.
For the SPX combining the hybrid ETF options plus SPX 2X ETF (outlook 2 to 4 mns)
produces an indicator where, in this case, ETF options are a proxy for the SPY options.
Bearish sentiment remains below neutral.
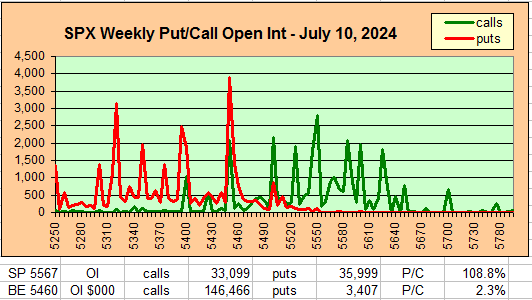
III. Options Open Interest
Using Thur closing OI, remember that further out time frames are more likely
to change over time, and that closing prices are more likely to be effected.
Delta hedging may occur as reinforcement, negative when put support is broken
or positive when call resistance is exceeded. This week I will look
out thru July 1. A text overlay is used for extreme OI to improve readability,
P/C is not changed. Also, this week includes a look at the GDX for Dec exp.
A new addition is added for OI $ amounts with breakeven pts (BE) where
call & put $ amounts crossand $ volume.
With Fri close at SPX 5667, options OI for Mon is moderate with near price call
resistance at 5575. There is little near put support, but momentum may
keep prices above 5550. Next resistance is 5625.
Wed has small SPX OI where SPX could fall to the low 5500s if CPI disappoints.
For Fri moderate SPX OI indicates more put support and less relative call
resistance below 5550. Possible range is 5450-5550.
IV. Technical / Other
This week I wanted to take a brief look at the Combined Put-Call Revised
indicator (Equity + ETF + SPX), .
The following uses barcharts.com as a source and discusses S&P futures (ES) as a third
venue of stock sentiment in addition to options and ETFs. The non-commercial/commercial
spread represents a LT bearish sentiment (dumb money/smart money) indicator. As explained in investopedia,
commercial investors (red) are institutions and are smart money, while non-commercials (green) are speculators such as
hedge funds and are dumb money. Here is the current barchart graph
for the S&P 500 (top) and trader positions (1st bot) with positives as net longs and negatives
as net shorts.
Bearish sentiment is represented by the spread and is positive if red > green
(Buy) and negative if green > red (Sell). ES (SPX) sentiment is
neutral at 0.0 SD, NQ (NDX) is near a weak Sell -0.75 SD, YM (DJIA) neutral at 0.0 SD, Dow theory no longer supports DJIA.
Click dropdown list to select from the following options:
Tech / Other History
2024
2023
2022
Other Indicators
Conclusions. The Supreme Court ruling makes any progress in
further Trump prosecutions questionable until after the election and removes a
major source of uncertainty. If all cases are delayed and Trump wins the
election, he could just pardon himself of all wrong doing and the markets could
see a 1929-like melt up. Much will be determined over the next few weeks
by the outllook for future court cases against Trump
Weekly Trade Alert. A VST pullback mid-week looks likely, but
markets may recover by Fri. Updates @mrktsignals.
It's funny that you mention a melt up like 1929 as there's a very large cycle in play that states that 2027 will be identical to 1929, which would be the 3rd year into the next presidential term of Trumps second term. It was the 7th year in Calvin Coolidge 8 year term, so there a lot of similarity there.
Charles Nenner talked about 2027 as a major cycle top in a video interview he did about a year ago, so you could be on to something there?


It's funny that you mention a melt up like 1929 as there's a very large cycle in play that states that 2027 will be identical to 1929, which would be the 3rd year into the next presidential term of Trumps second term. It was the 7th year in Calvin Coolidge 8 year term, so there a lot of similarity there.
ReplyDeleteCharles Nenner talked about 2027 as a major cycle top in a video interview he did about a year ago, so you could be on to something there?