Saturday, January 20, 2018

Was Last Week a Warning?

Two weeks ago, I was looking for a pullback into mid-Jan then up to the EOM, but last week began to look for higher prices into monthly options expiration, and the market delivered a little of both with what looked like a consolidation for the SPX in what EW analysts call a 4th wave triangle.  The sharp selloff from SPX 2808 Tue increased bearish sentiment (Avi calling a top again) to the point where higher prices are likely short term, but also show signs of a larger decline ahead.

I. Sentiment Indicators

The overall Indicator Scoreboard continues to show extremely low levels of bearishness.


While the Short Term Indicator (VXX $ volume and Smart Beta P/C) had a very small uptick in bearishness due to divergences in the two components.


The VXX $ volume saw a sharp uptick comparable to the Jul 2017 SPX 50 pt decline, supporting higher prices short term.


The Smart Beta P/C (Equity Calls/ETF Puts), however,  saw a sharp drop as individuals seemed to be piling into Equity Calls, which is usually a sign of excess frothiness.  So overall, higher prices are likely but with higher risk.


The SPX short term ETFs SPXU/UPRO also saw a sharp run up in bearish sentiment, matching the early Dec pullback of SPX 40 pts that was followed by a rally of 180 pts.


The NDX short term ETFs SQQQ/TQQQ sentiment has also spiked higher reaching the BUY level.  It is very possible that a topping process similar to mid 2015 forms where the SPX traded in a 5% range for several months (2000-2100), even as the NDX continued higher into Jul due to the higher level of bearishness.


Bond sentiment (TNX) was virtually unchanged even as rates broke above the 2.6% area with 2.7-2.8% seen as the first area that could be a drag on the SPX.


The gold miners (HUI) seem to have run into strong resistance at HUI 200 and GDX 24 with little support from sentiment which is also unchanged.  Target updates in the options OI section.


II. Options Open Interest

This week I will take a look at Feb's monthly options for VIX and GDX as well as weekly and monthly for SPY (close 280.4, SPX 2810).  Looking at the SPY for Wed, we a "most likely" at 278.5, but delta hedging over 280 can push prices higher with strong support at 276.


For Fri, SPY "most likely" drops to 277.5 with delta hedging over 280 and strong resistance at 284-85.


For EOM Jan, the most noticeable feature is huge support at SPY 273-74, beyond that we also have delta hedging from 278 to 281, and "most likely" at 277.


Looking at Feb monthly for SPY, over 280 then next resistance is 286, below 280 could pust down to the "most likely" at 277 and the relatively large number of calls below 277 could push down to 273.


For the Feb VIX, strong put support at 12 and call resistance at 15 is likely to keep the VIX in s tight range with a "most likely" at 12.5.  A move over 15 could run up to 21 with delta hedging.  Last week started at 10.4, ran up to 12.8, then fell back to 11.3, so this implies more volatility than seen recently.


For Feb GDX, we have support at 23 and resistance at 25, "most Likely" is 23.5.  The most noticeable feature is lack of support/resistance outside this range that could mean a large move is possible in either direction.


Conclusions.  Last Tue's sharp reversal and 40 pt SPX drop from a high at 2808 was apparently viewed as an important top by many as shown by sentiment using VXX $Vol, SPXU/UPRO, and SQQQ/TQQQ that indicate a short term rally is likely to EOM Jan.  Likely targets are SPX 2840-50.  SmartBeta PC, VIX Call Indicator (last week), and VIX options OI point to a possible volatile period ahead (EOM with FOMC?) thru Feb.  Note: chart on BA last 18 mns looks like Bitcoin at top.

Weekly Trade Alert.  Sentiment has now reached a level supporting a short term long with a target of SPX 2840-50 by EOM, but I would like to see a pullback early in the week to TL support at DJIA 25900 and SPX 2800.  Updates @mrktsignals.

Investment Diary, update 2017.10.28, Indicator Primer
Article Index 2017 by Topic
Article Index 2016 by Topic

© 2017 SentimentSignals.blogspot.com

Saturday, January 13, 2018

When Is Enough Enough?

It is clear that the stock market is in the final stages of a melt up, but how much higher can it go?  Bitcoin did not stop until it began to go up 10% a day for an entire week to start last Dec.  At the rate the SPX is going we could  see 2850 next week and 3000 by the end of Jan.  As I mentioned on Dec 26, the consensus building of an EOY target for 2018 of SPX 3000 was more likely to see a melt up or a failure.  Sentiment is now pointing to a pullback starting by early Feb, but what happens afterwards depends on the eagerness of the bears.

I. Sentiment Indicators

The overall Indicator Scoreboard is little changed from last week as the level of bearishness is about as low as it can go.


The Short Term Indicator (VXX $ volume and Smart Beta P/C) has continued to hover at levels that marked the mid-2015 top in May and July.  Based on the behavior of its components the ultimate low equivalent of Apr 2015 may have already been seen last July.


The VXX $ volume has finally dropped back to the SELL level which we saw late Apr 2015 about a month before the top in the SPX.


The Smart Beta P/C continues to inch up as we saw in May of 2015 with the earlier bottom in Dec 2017 matching the late Apr 2015 SELL.  Overall, I am now considering the ST Indicator on a SELL even though the components are out of sync.


The NDX short term ETFs SQQQ/TQQQ  shows increased levels of bearishness even as the index has moved up 100 pts since last week.  The 7000 level is looking more likely.


Bond sentiment (TNX) reversed sharply last week, which may presage a final spurt upwards as we saw in Dec 2016 or not.  Interestingly there have been a couple of news events lately (China selling US bonds, bond guru warnings) that saw an AM spike to just below 2.6%, matched by weakness in stocks, then rallies in stocks and gold as rates fell back towards 2.55%.  A break above 2.6% may be a warning for stocks.


The gold miners (HUI) saw bearish sentiment rise as the HUI moved back to the 200 level that may allow for slightly higher prices.


II. Options Open Interest

Prices only fell below the SPY 273 level for a few minutes then delta hedging continued to push prices higher thru Fri (close SPY 277.9, SPX 2786).  Next week looks like it will be more of the same.  For Wed, a move below SPY 276 could drop to the "most likely" at 275, but over 276 delta hedging supports higher prices.


For Fri monthly optn exp, with SPY higher than 275 delta hedging supports higher prices to 280, a push over 280 has clear sailing upwards.  For Fri put support is not important.


III. Other

Last week saw a large jump in VIX call buying, larger and sharper than the early Aug 2017 period, which was followed by an SPX 74 pt plunge in two weeks.  Due to the low holiday vol, I have incorporated the same market vol adjustment used in the VXX $ vol since Jan 2016.  Mon saw 1.2M calls mostly Feb 14, Wed saw 2.2M evenly split between Jan and Feb with 300k 15s and 500k 25s each month that appeared to be a maturity spread (buy/write) so I dropped the number to 1.2M as a conservative read of the hedging potential.  Fri saw about 1.0M with 60/40 Feb and Mar.  The increase is now 78% of the avg vol.


Conclusions.  The recent run up has changed my outlook for a mid-month pullback and rally into EOM to a more imminent top.  Momentum may carry the market upward to the SPX 2850 level next week then consolidate to EOM.  Some Fed heads are talking about more forceful action to slow markets down, so Jan's FOMC (30-31) may give markets a pause EOM.  Using the VIX Call Indicator with the confirmation by the ST Indicator, my outlook is for a 3-5% pullback starting late Jan-early Feb and lasting 2-4 weeks.  Will the bears growl like they did with the Aug pullback causing another bullish romp?

Weekly Trade Alert.  No specific trades this week, last weeks call was aborted when the Tue-Wed pullback caused the VXX $ vol to double, setting up the EOW romp.  Updates @mrktsignals.

Investment Diary, update 2017.10.28, Indicator Primer
Article Index 2017 by Topic
Article Index 2016 by Topic

© 2017 SentimentSignals.blogspot.com

Saturday, January 6, 2018

A Strong Start to the New Year

Two weeks ago, I began warning that the traditional Santa rally was likely to be disappointing, but a January surprise was likely.  Was it ever, with an almost 70 pt rally in the SPX in 4 days.  My logic was that January is considered an important, but often misleading, indicator of the future for the stock market.  Similar to the January 2016 decline which turned many bearish before a 50% rally, a top this year is likely to be preceded by a strong January.  Only time will tell.  The long term forecast contrasts growth and interest rate outlooks.

I. Sentiment Indicators

The overall Indicator Scoreboard retreated back to the SELL area after a brief increase in bearishness the prior week.


The Short Term Indicator (VXX $ volume and Smart Beta P/C) declined slightly, but remained above recent lows.


The components of the ST Indicator are starting to show a divergence as the VXX $ volume is starting to fall sharply similar to late Apr 2015 before a pickup in volatility.


While the Smart Beta P/C has been inching up as was seen in early May of 2015.  With the major ETF sectors of SPY, QQQ and IWM, this may be due to continued hedging in the NDX/QQQ as seen in the following chart.


The NDX short term ETFs SQQQ/TQQQ still show relatively high levels of bearishness even as the targeted 6700 area is approached, indicating that higher levels, possibly 7000 are likely.


Bond sentiment (TNX) continued to fall, indicating strong movement into TLT based on signs of moderate growth with little inflation.  Still too early to tell what the effects of unwinding QE will be.


The gold miners (HUI) seem to be running out of gas as the targeted HUI level of 200 is reached.


II. Options Open Interest

Options OI was probably the best indicator of the runaway breakout in the SPY/SPX last week as the Opricot Fri chart by Wed showed a large buildup of puts supporting a rise to SPY 271.5 with little call resistance up to 274 (close SPY 273.4/SPX 2743).


Looking forward to the next two weeks, it looks like there could be a small pullback into mid month (SPX 2700 ish), but an EOM rally is likely.  For Wed's SPY a move below 273 finds strong put support at 271 and a "most likely" at 272, but delta hedging provides support above 273.


For Fri, strong put support moves down to 270 and  "most likely" at 271, but delta hedging provides support above 272.


For the monthly expiration, "most likely" is SPY 269 (SPX 2700) with puts and calls offsetting (hedged) at lower levels and at higher levels a move over 270 could push to 274.  Could be a recipe for some volatility, especially if VXX $ Vol continues to drop.


Conclusions.  The explosive rally seen last week has failed to move the ST Indicator to a SELL so more upside is possible but a pullback over the next two weeks to the SPX 2700 level is seen likely using options OI.  More upside during earnings season seems likely, however, particularly in the tech/NDX sector

Weekly Trade Alert.  I hope some of you have better trading success than I have lately.  The Dec 29th selloff was simply a ploy to "shake out the weak hands" and resulted in my getting stopped out at BE, while the "gap and go" opens of the past week gave no apparent good entries.  Last weeks possible Short was cancelled via Twitter when SPY rose over 270 Wed due to possible delta hedging.  No specific trades this week, but a move to SPX 2750 may provide the opportunity for a small short if the VXX vol continues to decline thru Wed.  Updates @mrktsignals.

Investment Diary, update 2017.10.28, Indicator Primer
Article Index 2017 by Topic
Article Index 2016 by Topic

© 2017 SentimentSignals.blogspot.com

Saturday, December 30, 2017

Did the Grinch Steal Santa?

Last week's outlook for Santa to take a vacation this year certainly proved accurate, but Friday's action brought into question the early 2018 move over 2700 before a correction.  Bearish sentiment began to tumble by several measures during the week prior to Friday leaving more questions than answers about the immediate outcome.

I. Sentiment Indicators

The overall Indicator Scoreboard rose moderately from extremely low levels, but remain nowhere near supportive of higher prices.


The Short Term Indicator (VXX $ volume and Smart Beta P/C) also bounced, but has still not reached the levels of significant tops, so a continued decline is more likely to be a buying opportunity.


The SPX related ETFs are more ominous with the longer term SDS/SSO at levels where moderate pullbacks were seen over the last 6-8 months and much more extreme than before the 2015 corrections. SPXU/UPRO ratios are comparable.


Even the NDX bearish sentiment fell sharply last week prior to Friday, reaching the lowest levels since July, but I am still expecting a low comparable to Nov 2015 before a large pullback.


Bond sentiment (TNX) fell sharply as interest rates pulled back sharply toward the 2.4% level.  Combined with weakness in the dollar, global investors seem to believe that the GOP tax cuts are nothing more than a transfer of funds from the middle class to corporations and will do little to stimulate growth or inflation.


The reaction of the gold miners (HUI) was very muted, even as gold rallied strongly with weakness in the dollar and supported the view that tax cuts will not be inflationary.  The sharp drop in bearish sentiment is, however, likely to limit upside in prices.


II. Options Open Interest

I'm only going to look at the Wed/Fri pair this week.  For Wed, compared to last week about 35k of "new calls" were added late in the week.  Typically, this represents "smart money" and means the SPY should reach 270 by Wed, but last Fri close at 266.9 makes it less likely.


For Fri, the "most likely" here is SPY 266 which is just below current levels with good put support at 265.  A move back over 267 would begin delta hedging and support higher prices.


III Others

One other indicator that is more bearish is the VIX Call Indicator which rose by 55% of the mean in mid-Dec matching the levels seen in late Feb and early June of 2017.  This does seem to be less effective if not confirmed by the ST Indicator.


Conclusions.  The late week selloff has tempered my short term upside outlook, but I have noticed several times in the past that pullbacks that exceed well recognized support zones (SPX 2670, Avi Gilbert) in panic mode will often reverse.  In the case of a move back toward the SPX 2700 area that would be a SELL short term.  Overall sentiment says the market is at or near an INT top, but ST indicators say not quite yet.

Weekly Trade Alert.  My long from SPX 2680 was stopped out via post on Twitter at BE.  Outlook for next week is fairly uncertain, but a pop next week to SPX 2700+ thru Wed is a SELL with a target of 2660 (SPY 265+).  Updates @mrktsignals.

Investment Diary, update 2017.10.28, Indicator Primer
Article Index 2017 by Topic
Article Index 2016 by Topic

© 2017 SentimentSignals.blogspot.com

Saturday, December 23, 2017

No Santa, How about a January Surprise?

Since late Nov, it seems like every week starts strong then fades as the week progresses.  The strong rally on high volume for Dec opt exp is reminiscent of the Oct 2014 top, and generally indicates distribution. Higher prices are likely to start the new year, but Jan is likely to be a rocky month.  Thanks to loyal readers as page views passed 200k last month.  Happy Holidays and a prosperous New Year to all.

I. Sentiment Indicators

Bearish sentiment continued to retreat last week, as the overall Indicator Scoreboard was pushed lower by very low put/call ratios.


Even the Short Term Indicator (VXX $ volume and Smart Beta P/C) has pulled back to the area of recent lows, but still has a ways to go to match the lows of larger tops in 2015.


The NDX sentiment seem to be lagging other indicators which leads me to believe that after a weak first half to Jan, techs will likely power the market back up when earnings season is in full swing late Jan.


Bond sentiment (TNX) proved itself as a smart money indicator last week as rates rose from 2.36% to almost 2.5%.  The same behavior with a rounded bottom in sentiment was seen after the Nov election that resulted in much higher rates.  It's hard to tell what the effects will be of the reversal of QE, but I expect to see rates of 2.7-2.8% the first quarter and eventually 4%+ the next three years.  It has been over 40 years since we have seen a bear market in bonds, but a move to 4% is about a 30% drop in price from the highs for 20 year bonds (TLT).

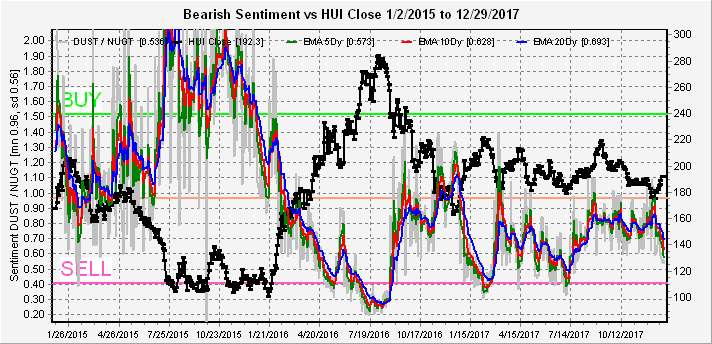
For the gold miners (HUI), the recent rally has pushed sentiment back to its recent lows so I doubt that prices will push much higher than the 200 level (+ 4-5%).


II. Options Open Interest

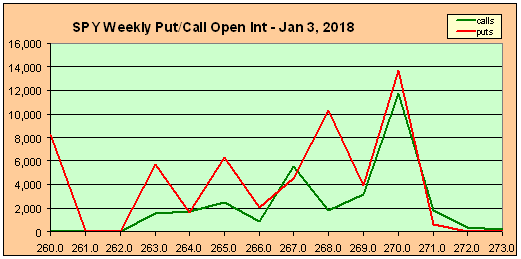
We did not get the pickup in volatility suggested by the VIX options last week as the SPX only rose to 2695 then fell to 2676.  This week I want to focus on the SPY, looking at possible turns thru the Jan 19th opt exp (current SPY 267.5, SPX 2683).

The Fri Dec 29 SPY large call open int at 267 may continue to act as support with positive delta hedging with 270 the next resistance level, so probably a small positive bias thru EOY.


Things start to look interesting in Jan, with the Wed put support rising to an important level not seen in a while.  It is doubtful that this is smart money as the popular bet is a tax-related selloff to start the year, but is more likely to push the SPY over 270 thru Wed.  One popular EW analyst has an ED target of SPX 2720-30, DJIA 25,200+.


By Fri, however, call resistance is likely to push prices lower.  As long as 267 holds, delta hedging may prop up prices, otherwise support drops down to 265+.


For Fri Jan 12, there is a modestly positive bias from put support with a "most likely" range of 267-69.


For the monthly opt exp, down is the most likely direction with modest support at 266 and then lower at 262.  So the overall outlook is a 4-5% pullback thru Jan opt exp.


Conclusions.  The outlook based on the opt open int and supported by sentiment is that Santa may be limping along thru year end, but that the new year is likely to start with a bang, followed by a fairly sharp reversal.

Weekly Trade Alert.  Longs may be accumulated in the SPX 2680-90 area with a stop at recent lows (2676) and an early Jan target of SPX 2720-30.  Updates @mrktsignals.

Investment Diary, update 2017.10.28, Indicator Primer
Article Index 2017 by Topic
Article Index 2016 by Topic

© 2017 SentimentSignals.blogspot.com