On Friday, I was watching intently to see the stock markets reaction to the March jobs data as that may be a key indicator as to how the market reacts to the "depression like" economic data expected to be released over the next few weeks. The first two hours after the release were unsure before the markets finally decided to head south. For may years now, bad news was considered "good news" because it meant that the Fed would increase liquidity, but the Fed is now running very low on gas after the March 1.5% cut in the Fed funds rate and announcing QE-finity, and more bad news may not have any effect on Fed actions. If the latter is true then I expect the SPX to grind lower into to the Apr jobs release in early May that may be truly historic (bad). In 2009, I predicted that the March lows would occur with the jobs release early March, and again feel that this may mark a significant low (SPX 2050-2150). Barring a "miracle cure" for Covid-19, how significant will depend on sentiment. Several LT indicators discussed in Tech/Other indicate not that significant.
For the next few weeks, if the markets do grind lower, I expect this to be a much less volatile decline, ie, down days of SPX 30-50 pts with intermittent rallies rather that a series of 100-200 pt down days as we saw in March. The VIX will probably fall to the mid-30's during the decline, and if there is a full 50% retrace for a "summer rally" to the mid-, upper-teens.
Going forward I will start the charting period from July 2018 rather than Jan because the charts are becoming difficult to read.
I. Sentiment Indicators
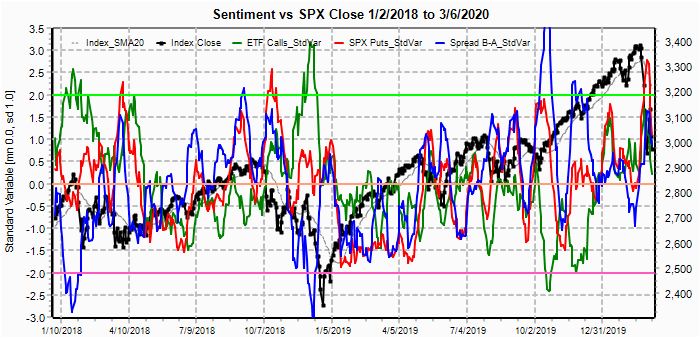
The overall Indicator Scoreboard (INT term, outlook two to four months) bearish sentiment remains high and should fall toward neutral similar to Nov 2018 before a final move down. Potential exists for distortion due to included extreme ETF sentiment, more in Tech/Other.
The INT view of the Short Term Indicator (VXX $ volume and Smart Beta P/C [ETF Puts/Equity Calls], outlook two to four months, no SPX volume adj) bearish sentiment has fallen sharply and much like the Indicator Scoreboard is expected to reach neutral before a final move down (w5 of A).
Bonds (TNX). Interest rates continue to move lower even as sentiment follows.
For the INT outlook with LT still negative, the gold miners (HUI) bearish sentiment is again moving lower as "helicopter money" has the gold bugs looking for higher inflation. Direxion has announced that DUST & NUGT will be converted to 2X in May due to extreme volatility recently with both now down about 90% from highs over the last year.
II. Dumb Money/Smart Money Indicators
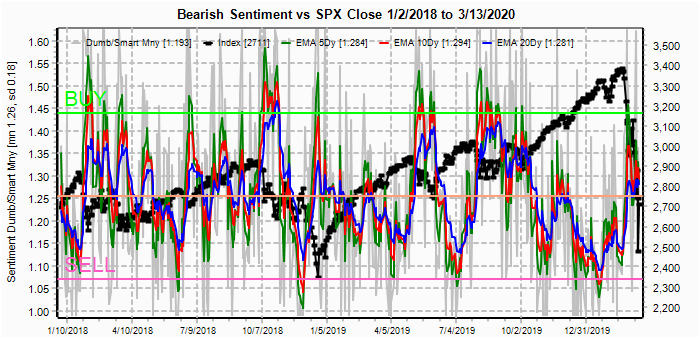
The option-based Dumb Money/Smart Money Indicator as short/INT term (outlook 2 to 4 mns/weeks) has moved down sharply but not yet reaching the levels seen before the Dec 2018 downturn.
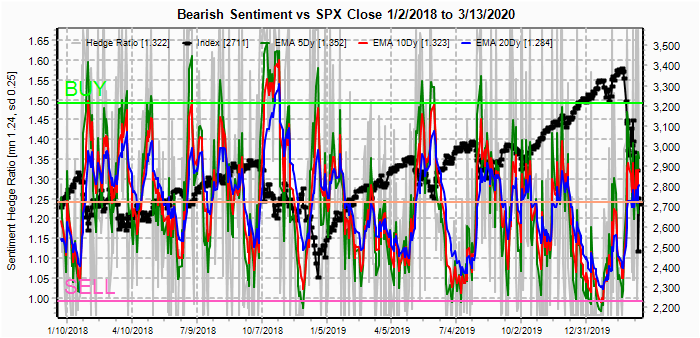
And the sister options Hedge Ratio sentiment remains near neutral, indicating only moderate expected volatility.
The INT term SPX Long Term/Short Term ETFs (outlook two to four wks/mns) bearish sentiment (2x DM/3x SM) has moved to the SELL level as DM is showing more bullishness than SM.
III. Options Open Interest
Using Thur closing OI, remember that further out time frames are more likely to change over time, and that closing prices are more likely to be effected. Delta hedging may occur as negative reinforcement when put support is broken or call resistance is exceeded. This week I will look out thru Apr 17 end of week only. Also, This week includes a look at the GDX for Apr exp.
With Fri close at SPX 2489, options OI for Thur is light with modest put support at 2450 and a likely close for the week over 2500.
For Fri 17 PM, large OI over SPX 2500 could result in a sharp rally, but below 2500 there is little put support to prevent a large decline. Hard to call.
Using the GDX as a gold miner proxy closing at 25, overlapping puts and calls indicate a wide potential range possible between 23 and 30, with a bias to 26-28.
Currently the TLT is 168.5 with the TNX at 0.59%.
IV. Technical / Other
For the very ST, the past couple days have seen the SPX compressed between 2550 and 2450 using the 4hr SMAs (23, 46, 69) and a sustained break either way will probably indicate the next trend.
From an INT perspective, the McClellan Summation Index was shown two weeks ago with the SPX at 2305 to indicate a probable ST bounce, but since readings of < -1000 are crash warnings, the weak bounce indicates trouble ahead.
Even with the strong bounce of the SPX off the Mar lows of 20%, the NYSE AD Line has only seen a very weak bounce, much like the Nov 2018 bounce from the Oct lows compared to the strong bounce off the Feb 2018 lows.
My LT favorite volume indicator, the NYUPV/NYDNV has reached a level comparable to the Aug 2015 "flash crash" lows, but has failed to rally further as the market has rebounded. The very strong rally in 2015 for the indicator to well over 2.0 for both LT SMAs was followed by an almost 100% gain for the SPX from 1800 to 3400 over the next few years. For those expecting the same from the 2020 selloff are likely to be disappointed without a dramatic improvement in the indicator. The weak indicator showing after the Feb 2018 lows was only followed by a brief return to the ATH before an even larger decline, and the rally off the Dec 2018 lows resulted in stronger indicator readings and stronger move to ATH. It;s too early to see where this will end up in 2020, but so far looks very weak.
Finally a look at the Rydex Bear/Bull ETF ratio that may indicate why the high bearishness currently for the SPX and NDX is not as bullish as it seems. First, the current readings look very bullish (high bearish sentiment) for the last three years.
However, when for the LT, the rounded bottom in very low sentiment is much like that seen in 2000 which many consider to be the first in a series of Fed-induced liquidity bubbles. The first was Greenspan after the 1998 LTCM crisis, leading to the "dot-com" bubble, next we had Bernanke with the 2008-09 financial crisis following the housing bubble, and now J. Powell and the "everything bubble". Comparing 2001 to 2020 the current spike in bearish sentiment resembles that of the first leg down from mid-2000 to early 2001 and may indicate that only 40% of the bear market is over.
Conclusions. Last week I indicated an expected retest/lower lows on SPX mid-Apr partially due to the expected return to work date proposed by Trump, but that has been put off to the end of Apr. Now with the Covid-19 crisis stronger than expected, the most likely bottom seems to be early May with the Apr jobs data. The target remains SPX 2050-2190 before a summer rally and with more downside expected thereafter.
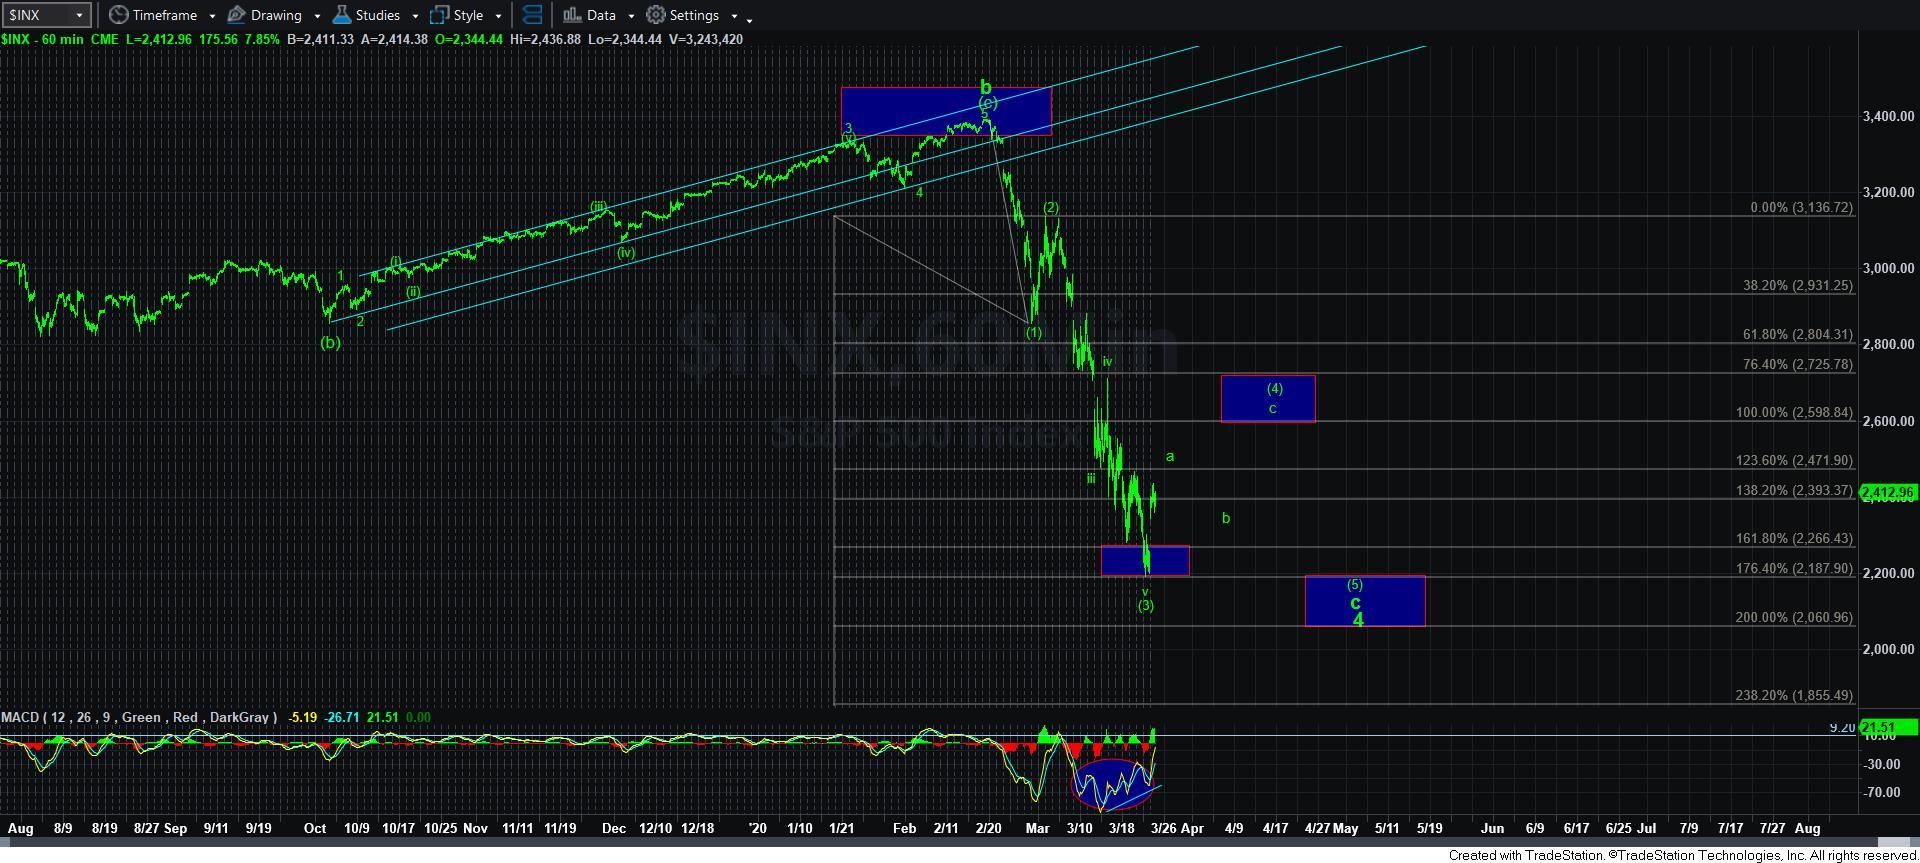
Weekly Trade Alert. ST remains hard to call and some EW analysts are calling this a W4 expanded flat that whipsaw between a wide range before a final move, usually a continuation move (down). Updates @mrktsignals.
Investment Diary,
Indicator Primer,
update 2020.02.07 Data Mining Indicators,
update 2019.04.27 Stock Buybacks,
update 2018.03.28 Dumb Money/Smart Money Indicators
Article Index 2019 by Topic, completed thru EOY 2020.02.04
Article Index 2018 by Topic
Article Index 2017 by Topic
Article Index 2016 by Topic
Long term forecasts
© 2020 SentimentSignals.blogspot.com
Saturday, April 4, 2020
Saturday, March 28, 2020
To Bull or Not to Bull
In Jan 2019, I was virtually the only one calling for a V-bottom off the Dec lows while most were calling for either the beginning of a 2008-09 bear market or at least a retest of the lows. At the time I also pointed out the potential for a rally structure similar to that off the Oct 2014 lows thru the May 2015 period. This continued to be accurate thru Nov 2019, until the final blow off stage. But now the roles seem to be reversed.
Over the past two weeks, I pointed to similarities to the 2008-09 period, but now many are looking at market action in reaction to the extraordinary stimulus from both the Fed's QE-finity and massive fiscal bailouts as the beginning of a V-bottom similar to the Mar 2009 lows. My approach is to first look at sentiment using a variety of measures and then look for price patterns with similar sentiment. Sentiment is still most similar to that of the first down leg in Oct 2018, implying that the worst is still to come.
Last week, I showed that the extreme low of the McClellan Summation Index (-1200) was comparable to the July 2008 low. Two weeks ago, I compared the Feb-Mar 2020 decline to that from Oct 2007 to Jan 2008 with an accelerated time frame of about 1 day in 2020 equal to 1 week in 2007-08. Last weeks three day rally comprised a similar 38% retracement to the two week rally off the Jan 2008 lows. Charts and more in Tech/Other.
I. Sentiment Indicators
The overall Indicator Scoreboard (INT term, outlook two to four months) bearish sentiment has only begun to decline. Both the early and late 2018 sharp decline were followed by retests or lower lows. Sentiment appears to be similar to that of early Oct 2018 before the Nov trading range of SPX 2600-2800.
The INT view of the Short Term Indicator (VXX $ volume and Smart Beta P/C [ETF Puts/Equity Calls], outlook two to four months) bearish sentiment (SPX vol adjusted) never reached the levels seen in the two major selloffs of 2018, but is also now in the range of Oct-Nov 2018.
One adjustment that I made several years ago to the VXX $ Vol after the Jan 2016 decline was to adjust for SPX daily volume since the low Dec 2015 vol distorted results. For Feb-Mar 2020 SPX volume has been very high and may have understated VXX $ Vol and the following chart is unadjusted. Here, we see that VXX $ Vol composite did slightly exceed the Oct 2018 decline but also never reached the extremes of Feb and Dec 2018.
Bonds (TNX). Bond investors seem to be "All in", but with backing by the Fed with the announcement of QE-finity, downside price risk seems low as long as inflation risk is low.
For the INT outlook with LT still negative, the gold miners (HUI) bearish sentiment briefly rose to the INT BUY level early in the week, but the ST 50% retracement rally sent sentiment back to the SELL area.
II. Dumb Money/Smart Money Indicators
The option-based Dumb Money/Smart Money Indicator as short/INT term (outlook 2 to 4 mns/weeks) rose only moderately from the SELL levels of Jan 2020 and has now declined to the 1.1-1.15 levels showing a strong warning.
And the sister options Hedge Ratio sentiment is similar with a weaker warning from the 1.15-1.2 levels.
No SPX or NDX ETF charts this week.
III. Options Open Interest
Using Thur closing OI, remember that further out time frames are more likely to change over time, and that closing prices are more likely to be effected. Delta hedging may occur as negative reinforcement when put support is broken or call resistance is exceeded. Due to extreme volatility, this weeks outlook is EOM, Mar 31 and NFPR, Apr 3. Also, This week includes a look at the TLT for Apr exp.
With Fri close at SPX 2541, options OI for Tue EOM shows room for volatility between strong put support at SPX 2300 and 2570 with call resistance moderate at 2530 and 2550 and strong at 2590. Whipsaw between 2400 and 2600 is possible.
NFPR Fri has Smaller OI with most positions hedged (calls and puts offset) down to put support at SPX 2350. A drop below 2400 is possible.
Using the GDX as a gold miner proxy closing at 23.47, last week showed put support at 23 and 25-7 with call resistance at 24 and 28. GDX rose from 21 to 27 before falling to support.
Currently the TLT is 167.7 with the TNX at 0.75%. There is very strong call resistance at 175 with very little unhedged put support. Prices could fall to 150, but given economic uncertainty prices should remain in the 160s.
IV. Technical / Other
This is an updated weekly chart from 2008 which shows a five wave decline (EW) from the Oct 2007 ATH to the Mar 2008 lows. Note the extremely sharp w4 of A down late Jan which was a 38% retrace of w1-3 similar to last weeks 3 day retrace rally of 37%. What followed was a w5 retest/lower low. Using a similar timeline with 1+ day in 2020 to 1 week in 2008 implies a decline into mid Apr before a larger 50% retrace rally, note timing is likely to vary going forward. A decline to about 2100 would imply a retrace rally of A to about SPX 2750.
Although I disagreed with Avi Gilbert prior to the Feb top when his primary count was for a continued rally into the Fall to SPX 3700 because sentiment strongly implied a 30-40% decline was more likely. His latest public outlook shows a similar price pattern with a w4 top between 2600 and 2725 with an expected w5 low between 2060 and 2190 (SPX 60 min).
Conclusions. A lower low for the SPX in the 2050-2190 area may be the best oppty for a swing trade since the current decline began in Feb. With many of the declines and rallies since Feb beginning with large gaps of 50% or more of the entire move, it was impossible to provide any meaningful outlook with weekend posts, and to tell the truth I spend most of my free time grocery shopping now that it takes 2-3 trips to find everything you are looking for. The next two weeks may be very important in determining the nature of the current selloff, since a 5 wave decline in EW implies the next opposite move is corrective and probably means we are in the beginning of a larger bear market.
Weekly Trade Alert. A lower low by mid-Apr is likely when firms start releasing their forward earning guidance that are likely to be awful. A reprieve with summer weather may usher in a "summer rally" and a 50% rally of the entire decline similar to that seen in Apr-May of 2008, especially if Covid-19 takes a breather. Updates @mrktsignals.
Investment Diary, Indicator Primer,
update 2020.02.07 Data Mining Indicators,
update 2019.04.27 Stock Buybacks,
update 2018.03.28 Dumb Money/Smart Money Indicators
Article Index 2019 by Topic, completed thru EOY 2020.02.04
Article Index 2018 by Topic
Article Index 2017 by Topic
Article Index 2016 by Topic
Long term forecasts
© 2020 SentimentSignals.blogspot.com
Over the past two weeks, I pointed to similarities to the 2008-09 period, but now many are looking at market action in reaction to the extraordinary stimulus from both the Fed's QE-finity and massive fiscal bailouts as the beginning of a V-bottom similar to the Mar 2009 lows. My approach is to first look at sentiment using a variety of measures and then look for price patterns with similar sentiment. Sentiment is still most similar to that of the first down leg in Oct 2018, implying that the worst is still to come.
Last week, I showed that the extreme low of the McClellan Summation Index (-1200) was comparable to the July 2008 low. Two weeks ago, I compared the Feb-Mar 2020 decline to that from Oct 2007 to Jan 2008 with an accelerated time frame of about 1 day in 2020 equal to 1 week in 2007-08. Last weeks three day rally comprised a similar 38% retracement to the two week rally off the Jan 2008 lows. Charts and more in Tech/Other.
I. Sentiment Indicators
The overall Indicator Scoreboard (INT term, outlook two to four months) bearish sentiment has only begun to decline. Both the early and late 2018 sharp decline were followed by retests or lower lows. Sentiment appears to be similar to that of early Oct 2018 before the Nov trading range of SPX 2600-2800.
The INT view of the Short Term Indicator (VXX $ volume and Smart Beta P/C [ETF Puts/Equity Calls], outlook two to four months) bearish sentiment (SPX vol adjusted) never reached the levels seen in the two major selloffs of 2018, but is also now in the range of Oct-Nov 2018.
One adjustment that I made several years ago to the VXX $ Vol after the Jan 2016 decline was to adjust for SPX daily volume since the low Dec 2015 vol distorted results. For Feb-Mar 2020 SPX volume has been very high and may have understated VXX $ Vol and the following chart is unadjusted. Here, we see that VXX $ Vol composite did slightly exceed the Oct 2018 decline but also never reached the extremes of Feb and Dec 2018.
Bonds (TNX). Bond investors seem to be "All in", but with backing by the Fed with the announcement of QE-finity, downside price risk seems low as long as inflation risk is low.
For the INT outlook with LT still negative, the gold miners (HUI) bearish sentiment briefly rose to the INT BUY level early in the week, but the ST 50% retracement rally sent sentiment back to the SELL area.
II. Dumb Money/Smart Money Indicators
The option-based Dumb Money/Smart Money Indicator as short/INT term (outlook 2 to 4 mns/weeks) rose only moderately from the SELL levels of Jan 2020 and has now declined to the 1.1-1.15 levels showing a strong warning.
And the sister options Hedge Ratio sentiment is similar with a weaker warning from the 1.15-1.2 levels.
No SPX or NDX ETF charts this week.
III. Options Open Interest
Using Thur closing OI, remember that further out time frames are more likely to change over time, and that closing prices are more likely to be effected. Delta hedging may occur as negative reinforcement when put support is broken or call resistance is exceeded. Due to extreme volatility, this weeks outlook is EOM, Mar 31 and NFPR, Apr 3. Also, This week includes a look at the TLT for Apr exp.
With Fri close at SPX 2541, options OI for Tue EOM shows room for volatility between strong put support at SPX 2300 and 2570 with call resistance moderate at 2530 and 2550 and strong at 2590. Whipsaw between 2400 and 2600 is possible.
NFPR Fri has Smaller OI with most positions hedged (calls and puts offset) down to put support at SPX 2350. A drop below 2400 is possible.
Using the GDX as a gold miner proxy closing at 23.47, last week showed put support at 23 and 25-7 with call resistance at 24 and 28. GDX rose from 21 to 27 before falling to support.
Currently the TLT is 167.7 with the TNX at 0.75%. There is very strong call resistance at 175 with very little unhedged put support. Prices could fall to 150, but given economic uncertainty prices should remain in the 160s.
IV. Technical / Other
This is an updated weekly chart from 2008 which shows a five wave decline (EW) from the Oct 2007 ATH to the Mar 2008 lows. Note the extremely sharp w4 of A down late Jan which was a 38% retrace of w1-3 similar to last weeks 3 day retrace rally of 37%. What followed was a w5 retest/lower low. Using a similar timeline with 1+ day in 2020 to 1 week in 2008 implies a decline into mid Apr before a larger 50% retrace rally, note timing is likely to vary going forward. A decline to about 2100 would imply a retrace rally of A to about SPX 2750.
Although I disagreed with Avi Gilbert prior to the Feb top when his primary count was for a continued rally into the Fall to SPX 3700 because sentiment strongly implied a 30-40% decline was more likely. His latest public outlook shows a similar price pattern with a w4 top between 2600 and 2725 with an expected w5 low between 2060 and 2190 (SPX 60 min).
Conclusions. A lower low for the SPX in the 2050-2190 area may be the best oppty for a swing trade since the current decline began in Feb. With many of the declines and rallies since Feb beginning with large gaps of 50% or more of the entire move, it was impossible to provide any meaningful outlook with weekend posts, and to tell the truth I spend most of my free time grocery shopping now that it takes 2-3 trips to find everything you are looking for. The next two weeks may be very important in determining the nature of the current selloff, since a 5 wave decline in EW implies the next opposite move is corrective and probably means we are in the beginning of a larger bear market.
Weekly Trade Alert. A lower low by mid-Apr is likely when firms start releasing their forward earning guidance that are likely to be awful. A reprieve with summer weather may usher in a "summer rally" and a 50% rally of the entire decline similar to that seen in Apr-May of 2008, especially if Covid-19 takes a breather. Updates @mrktsignals.
Investment Diary, Indicator Primer,
update 2020.02.07 Data Mining Indicators,
update 2019.04.27 Stock Buybacks,
update 2018.03.28 Dumb Money/Smart Money Indicators
Article Index 2019 by Topic, completed thru EOY 2020.02.04
Article Index 2018 by Topic
Article Index 2017 by Topic
Article Index 2016 by Topic
Long term forecasts
© 2020 SentimentSignals.blogspot.com
Saturday, March 21, 2020
The Curse of Jekyll Island
A series of financial panics in the US starting in the late 1800s, including the 1893 and 1896 depressions, the 1901 railroad share panic and the panic of 1907 that resulted in a 50% decline in the NYSE, contributed to the gathering of banking leaders on Jekyll Island the Fall of 1910. The result was establishment of a national bank of last resort to centralize the US flow of banking reserves and it became known as the Federal Reserve System. Things to seemed to work well for 19 years increasing complacency and public confidence in the stock markets until the blowoff in the fall of 1929 led to the markets crash and the depression of the 1930's.
The main reason for the history lesson is that even before the advent of Covid-19, markets were showing a similar pattern of behavior, only needing a spark to start a blazing fire. 19 years after the the 1981 recession we had the tech bubble and crash, and 19 years after 9/11 2001 we had the Trump everything bubble with overwhelming investor complacency based on the belief that the Fed can prevent or fix all catastrophes, but what if they can not?
Speaking of complacency, you would think that following the worse ST decline in stocks, including 1929, that investors would be lining up around the block to sell their stocks the same way they are lining up to buy bread and toilet paper because of Covid-19, but last week actually saw a reduction in fear as DM seems to be convinced that BTFD is now the way to go after panicking in Feb 2018 and Dec 2018.
I. Sentiment Indicators
The overall Indicator Scoreboard (INT term, outlook two to four months) bearish sentiment has now reached the level seen at the Oct 2018 lows that may support a trading range before lower lows/retest.
The INT view of the Short Term Indicator (VXX $ volume and Smart Beta P/C [ETF Puts/Equity Calls], outlook two to four months) bearish sentiment remains significantly below either the Feb or Oct 2018 lows, indicating more volatility ahead.
Taking a closer look at the VXX $ volume indicates that most of the complacency in the ST indicator is the lack of belief in higher volatility and may result in a VIX of 100 or more before a final bottom.
Bonds (TNX). Interest rates are starting to show extreme volatility. As measured by the TLT that reached a high of 180 this week from a 120 low a year ago, prices dropped as low as 144 during the week before closing at 159.
For the INT outlook with LT still negative, the gold miners (HUI) bearish sentiment rose from the extreme lows two weeks ago to about half way to neutral with prices closing near the lows for the week.
II. Dumb Money/Smart Money Indicators
The option-based Dumb Money/Smart Money Indicator as short/INT term (outlook 2 to 4 mns/weeks) turned lower for the week, dropping below neutral as the DM seems to be expecting a near-term bottom (SPX 2250-2350).
And the sister options Hedge Ratio sentiment is similar, again a sign of complacency especially given the selloff of 30% over the last few weeks.
This week I want to continue to follow the INT term SPX Long Term/Short Term ETFs (outlook two to four wks/mns) bearish sentiment (2x DM/3x SM) saw a sharp drop as the DM (2X) is now buying (BTFD) while SM has similar selling. The result was a sharp drop in sentiment, and is likel;y warning of lower prices ahead. NDX SM/DM shows similar sentiment.
III. Options Open Interest
With recent volatility extremes, SPX charts are of little use.
Using the GDX as a gold miner proxy closing at 20.55, two weeks ago the charts showed little put support below 25, and once support was broken a free fall occurred down to as low as 16.2 on Mon before rebounding. Looking at the Apr 17 exp, optn positions are very light compared to the previous 50-60K calls in the 35 range and negative delta hedging is likely. Only relevant support/resistance areas are 17 below and 23-24 above.
Currently the TLT is 159 with the TNX at 0.9%. After dropping to put support at 145, TLT rallied sharply thru weak overhead resistance.
IV. Technical / Other
Last week was weaker than expected and the 38% retrace may have been the one day rally in ES from Sun night lows of 2400 to Mon 2700 high. To get an idea of how oversold the SPX is, I want to review the NYSE McClellan Summation Index from 2005. We are now so oversold at -1183 that it is considered a crash warning (<-1000). The last two times this occurred was the Dec 2018 lows and July 2008. Sentiment was showing a strong BUY at the Dec lows, but not today so I am going to focus on July 2008.
What did the market do in July 2008? The SPX consolidated for two months to work off bearish sentiment and allow DM to BTFD before an even larger decline into Dec. This is consistent with investors outlook today where a "wait and see" attitude is taken to see if Covid-19 gets better (as China is already claiming) and if the extraordinary stimulus works its magic. But current sentiment is pointing to the less favorable outcome.
Conclusions. There are some indications that the first downward thrust may be nearing completion (aka Oct 2018), while DM BTFD indications are pointing to a somewhat weak rebound similar to Jul-Aug 2008 of a 10% range of maybe SPX 2250-2500. If notable economic improvement is not seen by the end of the 2nd Qtr, a big slide may be seen into the election.
Weekly Trade Alert. None. Updates @mrktsignals.
Investment Diary, Indicator Primer,
update 2020.02.07 Data Mining Indicators,
update 2019.04.27 Stock Buybacks,
update 2018.03.28 Dumb Money/Smart Money Indicators
Article Index 2019 by Topic, completed thru EOY 2020.02.04
Article Index 2018 by Topic
Article Index 2017 by Topic
Article Index 2016 by Topic
Long term forecasts
© 2020 SentimentSignals.blogspot.com
The main reason for the history lesson is that even before the advent of Covid-19, markets were showing a similar pattern of behavior, only needing a spark to start a blazing fire. 19 years after the the 1981 recession we had the tech bubble and crash, and 19 years after 9/11 2001 we had the Trump everything bubble with overwhelming investor complacency based on the belief that the Fed can prevent or fix all catastrophes, but what if they can not?
Speaking of complacency, you would think that following the worse ST decline in stocks, including 1929, that investors would be lining up around the block to sell their stocks the same way they are lining up to buy bread and toilet paper because of Covid-19, but last week actually saw a reduction in fear as DM seems to be convinced that BTFD is now the way to go after panicking in Feb 2018 and Dec 2018.
I. Sentiment Indicators
The overall Indicator Scoreboard (INT term, outlook two to four months) bearish sentiment has now reached the level seen at the Oct 2018 lows that may support a trading range before lower lows/retest.
The INT view of the Short Term Indicator (VXX $ volume and Smart Beta P/C [ETF Puts/Equity Calls], outlook two to four months) bearish sentiment remains significantly below either the Feb or Oct 2018 lows, indicating more volatility ahead.
Taking a closer look at the VXX $ volume indicates that most of the complacency in the ST indicator is the lack of belief in higher volatility and may result in a VIX of 100 or more before a final bottom.
Bonds (TNX). Interest rates are starting to show extreme volatility. As measured by the TLT that reached a high of 180 this week from a 120 low a year ago, prices dropped as low as 144 during the week before closing at 159.
For the INT outlook with LT still negative, the gold miners (HUI) bearish sentiment rose from the extreme lows two weeks ago to about half way to neutral with prices closing near the lows for the week.
II. Dumb Money/Smart Money Indicators
The option-based Dumb Money/Smart Money Indicator as short/INT term (outlook 2 to 4 mns/weeks) turned lower for the week, dropping below neutral as the DM seems to be expecting a near-term bottom (SPX 2250-2350).
And the sister options Hedge Ratio sentiment is similar, again a sign of complacency especially given the selloff of 30% over the last few weeks.
This week I want to continue to follow the INT term SPX Long Term/Short Term ETFs (outlook two to four wks/mns) bearish sentiment (2x DM/3x SM) saw a sharp drop as the DM (2X) is now buying (BTFD) while SM has similar selling. The result was a sharp drop in sentiment, and is likel;y warning of lower prices ahead. NDX SM/DM shows similar sentiment.
III. Options Open Interest
With recent volatility extremes, SPX charts are of little use.
Using the GDX as a gold miner proxy closing at 20.55, two weeks ago the charts showed little put support below 25, and once support was broken a free fall occurred down to as low as 16.2 on Mon before rebounding. Looking at the Apr 17 exp, optn positions are very light compared to the previous 50-60K calls in the 35 range and negative delta hedging is likely. Only relevant support/resistance areas are 17 below and 23-24 above.
Currently the TLT is 159 with the TNX at 0.9%. After dropping to put support at 145, TLT rallied sharply thru weak overhead resistance.
IV. Technical / Other
Last week was weaker than expected and the 38% retrace may have been the one day rally in ES from Sun night lows of 2400 to Mon 2700 high. To get an idea of how oversold the SPX is, I want to review the NYSE McClellan Summation Index from 2005. We are now so oversold at -1183 that it is considered a crash warning (<-1000). The last two times this occurred was the Dec 2018 lows and July 2008. Sentiment was showing a strong BUY at the Dec lows, but not today so I am going to focus on July 2008.
What did the market do in July 2008? The SPX consolidated for two months to work off bearish sentiment and allow DM to BTFD before an even larger decline into Dec. This is consistent with investors outlook today where a "wait and see" attitude is taken to see if Covid-19 gets better (as China is already claiming) and if the extraordinary stimulus works its magic. But current sentiment is pointing to the less favorable outcome.
Conclusions. There are some indications that the first downward thrust may be nearing completion (aka Oct 2018), while DM BTFD indications are pointing to a somewhat weak rebound similar to Jul-Aug 2008 of a 10% range of maybe SPX 2250-2500. If notable economic improvement is not seen by the end of the 2nd Qtr, a big slide may be seen into the election.
Weekly Trade Alert. None. Updates @mrktsignals.
Investment Diary, Indicator Primer,
update 2020.02.07 Data Mining Indicators,
update 2019.04.27 Stock Buybacks,
update 2018.03.28 Dumb Money/Smart Money Indicators
Article Index 2019 by Topic, completed thru EOY 2020.02.04
Article Index 2018 by Topic
Article Index 2017 by Topic
Article Index 2016 by Topic
Long term forecasts
© 2020 SentimentSignals.blogspot.com
Saturday, March 14, 2020
Chaos and Dislocations
We are likely in the midst of a once in a lifetime event in financial markets. In tracking many who called a top in Jan and made money in the early stages of the decline, they have been calling for a bottom since SPX 2750 and have lost even more trying to catch falling knives. Most EW followers fit this category as seen by Trader Joe where a 62% has been expected all week to SPX 3200 within a couple of weeks to days.
Personally, I prefer to adhere to Warren Buffets Rule #1 which is don't lose money since a 50% lose requires a 100% gain to break even. Most of the "bear market rallies" have only lasted 1 day and sometimes as little as 1 hour, so if you are a very nimble day trader you may have done OK, but I don't expect a tradeable rally until the Dec 2018 lows are tested at SPX 2350.
Speaking of dislocations, over the last 6 trading days the gold miners HUI index has fallen over 30% from 245 to 164 with the two biggest gold buyers on strike, first China selling to prop up their economy and now Russia not able to buy with an oil price war with the Saudi's. Specifically, on Thur Barrick Gold opened down 20% as sellers overwhelmed buyers, and Fri aft a massive sell order for GDX ETF drove prices down 25% during the day to 16.5 before a close at 19. ZH has been discussing the possibility of order imbalances for ETFs for months, and we are likely to see similar behavior for the broad mark avg ETFs such as QQQ and SPY before the crisis is over.
Although there are still some similarities to the Oct-Dec 2018 analog, this week I want to present a much more bearish analog using the 2008 financial crisis in the Tech/Other section that was presented in last week's Updates. In 2008, the first leg down was SPX -18% related to the Bear Stearns crisis thru Jan. With the first leg down in 2020 of 27% so far this could mean an ultimate low near SPX 1000, whew! Also a real-time indicator based on the TRIN is used for comparison.
I. Sentiment Indicators
The overall Indicator Scoreboard (INT term, outlook two to four months) bearish sentiment has risen sharply, now approaching the level of mid-Oct 2018, but this may be misleading due to the included 2X ETF sentiment (more in DM/SM section).
The INT view of the Short Term Indicator (VXX $ volume and Smart Beta P/C [ETF Puts/Equity Calls], outlook two to four months) bearish sentiment remains rather mild compared to Feb and Dec 2018. Way to much BTFD and belief in Fed interventions and bailouts. Last week I heard one trader say that the motto on the US$ should be changed from "In God we trust" to "In the Fed we trust", imagine what happens if faith is lost in FED interventions. Much more volatility ahead.
Bonds (TNX). Bond sentiment remain pinned to the lows, while interest rates remain low. I wonder what would happen to rates if the Fed stopped intervening, possibly something like the gold miners?
This week I wanted to look back to 2015 to see what a sentiment-based (3X EMAs) rally looked like, and compare it to today. The rally since mid-2018 has been based on talk of negative rates and collapse of the dollar, but looked what happened when rates collapsed - so did the gold miners. The gold miners (HUI) bearish sentiment remains near historical low levels, indicating that prices could fall much farther and stay down for a considerable period of time.
II. Dumb Money/Smart Money Indicators
The option-based Dumb Money/Smart Money Indicator as short/INT term (outlook 2 to 4 mns/weeks) remains close to neutral, indicating that the Fed induced rally hopes of the BTFDers are likely to be crushed. Thurs & Fri call options volume on the SPX rose to 1.1 & 1.2M, over three times the daily avg of 350k and higher than any time as far back as I could go (2016).
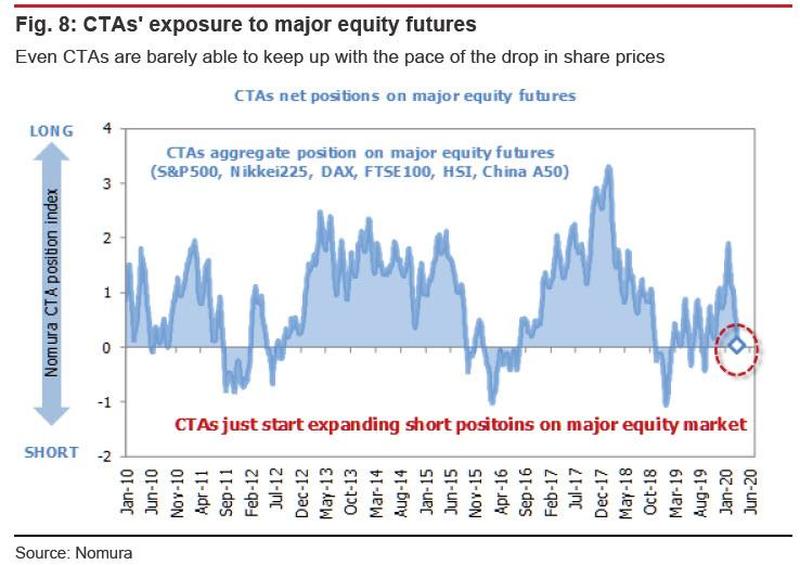
And the sister options Hedge Ratio sentiment is near neutral, indicating much more volatility ahead. An interesting article at ZH on hedging by Nomura about CTA hedging with a chart showing hedging at neutral (0) where -1.0 is usually seen at bottoms (now same as early Oct 2018).
This week I wanted to look at the SPX related DM/SM ETF indicator since extreme positions of the 2X ETFs may not be as impt, depending on the relative position to 3X ETFs. The most favorable outlook is DM (2X) selling and SM (3X) buying, but now both are strong sellers.
The INT term SPX Long Term/Short Term ETFs (outlook two to four wks/mns) bearish sentiment (2x DM/3x SM) has been a decent indicator for longer term outlooks and now shows that selling is stronger for DM with a slight positive bias, similar to Feb of 2018, but still a long way from a BUY. NDX SM/DM is inconclusive and is excluded.
III. Options Open Interest
With recent volatility extremes, SPX charts are of little use,
Using the GDX as a gold miner proxy closing at 19 from the prior weeks 29.4, last week showed a big increase of call resistance at 32-34 and only small put support at 27 and 25, and when prices fell below 25 the free fall began.
Currently the TLT is 153.9 with the TNX at 0.95%. Without Fed intervention, rates should rise with the TLT dropping to at least 147, but with an active Fed it is hard to tell. If rates do rise in spite of the Fed, it is probably an indication of a bigger problem.
IV. Technical / Other
First a look at the data mining indicator using the Equity P/C as SM compared to the overall CPC Revised. Although not perfect, higher levels are generally positive (missed Feb highs due to ext shock). Currently we have seen a rapid decline of about the same length as from the Oct 2018 lows to the Dec 2018 highs as Equity P/C is rising while ETC and SPX P/C are falling. Is another Dec 2018 style crash possible?
Looking at the 2008 analog, the first thing that jumps out is that the 2020 decline for a single day resembles the weekly decline for 2008 from the Oct 2007 high of SPX 1571 to the Jan low at 1270. After the low a 38% retrace 2 bars (week to 2020 day) and from 2480 from 3393 that is 2827, possible this week. Next came a lower retest that may be to Mar EOM and with the O/N ES low of 2400 Thur that could be 2350 in 2020. A somewhat larger retrace of 50% followed, now equal to about 2870.
2008 weekly.
2020 daily.
The TRIN or arms index is a complex ratio of advancing & declining issues and volume and is generally considered a FEAR indicator. Looking at the TRIN with 10 and 20 SMAs, which was selected based on similarity to some of my indicators, a rise to 1.25 is generally bullish (high fear) and a decline below 0.9 is bearish. Unfortunately the low last week left the TRIN SMAs near 1.0, well short of a bullish reading, so more volatility and/or lower prices are likely near term. This indicator is also updated intra-day so may be useful for spotting reversals or placing EOD trades.
2008.
2020.
Conclusions. One partial solution to the Covid-19 crisis is under development by Darpa which boosts the immune system to lessen the effect of the virus, This is still expected to take a couple of months to develop, but would probably alleviate a lot of fear for investors. The timing also lines up well with the 2020/2008 day/week analog.
The primary reason I mentioned the SPX 1000 level was that I think a break of the 2007 highs at 1571 would cause "true" panic and the expectation of a return to the 2009 lows. This may seem unrealistic, but the NYSE has already broken it's 2007 high, so who knows.
Otherwise, the general outline is in the Tech/Other Section.
Weekly Trade Alert. If we do manage a retrace to the SPX 2827 level this week with the TRIN around 1.0, that should provide a shorting oppty for a lower retest to SPX 2350. Updates @mrktsignals.
Investment Diary, Indicator Primer,
update 2020.02.07 Data Mining Indicators,
update 2019.04.27 Stock Buybacks,
update 2018.03.28 Dumb Money/Smart Money Indicators
Article Index 2019 by Topic, completed thru EOY 2020.02.04
Article Index 2018 by Topic
Article Index 2017 by Topic
Article Index 2016 by Topic
Long term forecasts
© 2020 SentimentSignals.blogspot.com
Personally, I prefer to adhere to Warren Buffets Rule #1 which is don't lose money since a 50% lose requires a 100% gain to break even. Most of the "bear market rallies" have only lasted 1 day and sometimes as little as 1 hour, so if you are a very nimble day trader you may have done OK, but I don't expect a tradeable rally until the Dec 2018 lows are tested at SPX 2350.
Speaking of dislocations, over the last 6 trading days the gold miners HUI index has fallen over 30% from 245 to 164 with the two biggest gold buyers on strike, first China selling to prop up their economy and now Russia not able to buy with an oil price war with the Saudi's. Specifically, on Thur Barrick Gold opened down 20% as sellers overwhelmed buyers, and Fri aft a massive sell order for GDX ETF drove prices down 25% during the day to 16.5 before a close at 19. ZH has been discussing the possibility of order imbalances for ETFs for months, and we are likely to see similar behavior for the broad mark avg ETFs such as QQQ and SPY before the crisis is over.
Although there are still some similarities to the Oct-Dec 2018 analog, this week I want to present a much more bearish analog using the 2008 financial crisis in the Tech/Other section that was presented in last week's Updates. In 2008, the first leg down was SPX -18% related to the Bear Stearns crisis thru Jan. With the first leg down in 2020 of 27% so far this could mean an ultimate low near SPX 1000, whew! Also a real-time indicator based on the TRIN is used for comparison.
I. Sentiment Indicators
The overall Indicator Scoreboard (INT term, outlook two to four months) bearish sentiment has risen sharply, now approaching the level of mid-Oct 2018, but this may be misleading due to the included 2X ETF sentiment (more in DM/SM section).
The INT view of the Short Term Indicator (VXX $ volume and Smart Beta P/C [ETF Puts/Equity Calls], outlook two to four months) bearish sentiment remains rather mild compared to Feb and Dec 2018. Way to much BTFD and belief in Fed interventions and bailouts. Last week I heard one trader say that the motto on the US$ should be changed from "In God we trust" to "In the Fed we trust", imagine what happens if faith is lost in FED interventions. Much more volatility ahead.
Bonds (TNX). Bond sentiment remain pinned to the lows, while interest rates remain low. I wonder what would happen to rates if the Fed stopped intervening, possibly something like the gold miners?
This week I wanted to look back to 2015 to see what a sentiment-based (3X EMAs) rally looked like, and compare it to today. The rally since mid-2018 has been based on talk of negative rates and collapse of the dollar, but looked what happened when rates collapsed - so did the gold miners. The gold miners (HUI) bearish sentiment remains near historical low levels, indicating that prices could fall much farther and stay down for a considerable period of time.
II. Dumb Money/Smart Money Indicators
The option-based Dumb Money/Smart Money Indicator as short/INT term (outlook 2 to 4 mns/weeks) remains close to neutral, indicating that the Fed induced rally hopes of the BTFDers are likely to be crushed. Thurs & Fri call options volume on the SPX rose to 1.1 & 1.2M, over three times the daily avg of 350k and higher than any time as far back as I could go (2016).
And the sister options Hedge Ratio sentiment is near neutral, indicating much more volatility ahead. An interesting article at ZH on hedging by Nomura about CTA hedging with a chart showing hedging at neutral (0) where -1.0 is usually seen at bottoms (now same as early Oct 2018).
This week I wanted to look at the SPX related DM/SM ETF indicator since extreme positions of the 2X ETFs may not be as impt, depending on the relative position to 3X ETFs. The most favorable outlook is DM (2X) selling and SM (3X) buying, but now both are strong sellers.
The INT term SPX Long Term/Short Term ETFs (outlook two to four wks/mns) bearish sentiment (2x DM/3x SM) has been a decent indicator for longer term outlooks and now shows that selling is stronger for DM with a slight positive bias, similar to Feb of 2018, but still a long way from a BUY. NDX SM/DM is inconclusive and is excluded.
III. Options Open Interest
With recent volatility extremes, SPX charts are of little use,
Using the GDX as a gold miner proxy closing at 19 from the prior weeks 29.4, last week showed a big increase of call resistance at 32-34 and only small put support at 27 and 25, and when prices fell below 25 the free fall began.
Currently the TLT is 153.9 with the TNX at 0.95%. Without Fed intervention, rates should rise with the TLT dropping to at least 147, but with an active Fed it is hard to tell. If rates do rise in spite of the Fed, it is probably an indication of a bigger problem.
IV. Technical / Other
First a look at the data mining indicator using the Equity P/C as SM compared to the overall CPC Revised. Although not perfect, higher levels are generally positive (missed Feb highs due to ext shock). Currently we have seen a rapid decline of about the same length as from the Oct 2018 lows to the Dec 2018 highs as Equity P/C is rising while ETC and SPX P/C are falling. Is another Dec 2018 style crash possible?
Looking at the 2008 analog, the first thing that jumps out is that the 2020 decline for a single day resembles the weekly decline for 2008 from the Oct 2007 high of SPX 1571 to the Jan low at 1270. After the low a 38% retrace 2 bars (week to 2020 day) and from 2480 from 3393 that is 2827, possible this week. Next came a lower retest that may be to Mar EOM and with the O/N ES low of 2400 Thur that could be 2350 in 2020. A somewhat larger retrace of 50% followed, now equal to about 2870.
2008 weekly.
2020 daily.
The TRIN or arms index is a complex ratio of advancing & declining issues and volume and is generally considered a FEAR indicator. Looking at the TRIN with 10 and 20 SMAs, which was selected based on similarity to some of my indicators, a rise to 1.25 is generally bullish (high fear) and a decline below 0.9 is bearish. Unfortunately the low last week left the TRIN SMAs near 1.0, well short of a bullish reading, so more volatility and/or lower prices are likely near term. This indicator is also updated intra-day so may be useful for spotting reversals or placing EOD trades.
2008.
2020.
Conclusions. One partial solution to the Covid-19 crisis is under development by Darpa which boosts the immune system to lessen the effect of the virus, This is still expected to take a couple of months to develop, but would probably alleviate a lot of fear for investors. The timing also lines up well with the 2020/2008 day/week analog.
The primary reason I mentioned the SPX 1000 level was that I think a break of the 2007 highs at 1571 would cause "true" panic and the expectation of a return to the 2009 lows. This may seem unrealistic, but the NYSE has already broken it's 2007 high, so who knows.
Otherwise, the general outline is in the Tech/Other Section.
Weekly Trade Alert. If we do manage a retrace to the SPX 2827 level this week with the TRIN around 1.0, that should provide a shorting oppty for a lower retest to SPX 2350. Updates @mrktsignals.
Investment Diary, Indicator Primer,
update 2020.02.07 Data Mining Indicators,
update 2019.04.27 Stock Buybacks,
update 2018.03.28 Dumb Money/Smart Money Indicators
Article Index 2019 by Topic, completed thru EOY 2020.02.04
Article Index 2018 by Topic
Article Index 2017 by Topic
Article Index 2016 by Topic
Long term forecasts
© 2020 SentimentSignals.blogspot.com
Saturday, March 7, 2020
More Volatility Than a Nashville Tornado
Last weeks stock market saw more volatility than any time over the past twenty years other than the depths of the 2008 financial crisis with the VIX exceeding 50 by Friday. I live just east of Nashville and was out of power for much of the week with tornadoes hitting on three sides, the closest about two miles away. The result was much like the SPX with a 100 pt rally the last half hour on Tue, a surprise half percent cut by the Fed Wed that gave back the rally, a retest of the Tue highs, then a move to Mon lows by Fri.
Sentiment indicators are still conforming to the Oct 2018 setup, but still seem likely to play out over a longer time frame thru the EOY. Next week looks like a retest of the SPX 2850s is likely by mid-week with a rally to EOM at SPX 3100+ to follow. So far the 50% retracement level from the Feb high/lows (3124) has proved elusive with Wed close at 3130 and Tue brief spike to 3139. Bearish sentiment in the overall and ST composites indicate that the volatility is just beginning, while record sentiment in the INT 2x ETF SPX and NDX show that limited downside (SPX 2600) is likely for the next several months.
I. Sentiment Indicators
The overall Indicator Scoreboard (INT term, outlook two to four months) bearish sentiment has risen sharply since late Feb but has only reached the level of the first down leg in Oct 2018, truly a scary thought given the relative size of the decline.
The INT view of the Short Term Indicator (VXX $ volume and Smart Beta P/C [ETF Puts/Equity Calls], outlook two to four months) bearish sentiment has risen only moderately higher than seen in Aug 2019. Again, an amazing amount of complacency probably due to faith in the Fed's ability to solve all problems by printing money as well as Trump's probable re-election over the less that stellar Dem front runners.
Bonds (TNX). Somebody has to be wrong as bond investors seem to believe the end of the world is coming and at the current pace rate will reach 0% in two weeks time, while stock sentiment is giving the "all clear" signal.
For the INT outlook with LT still negative, the gold miners (HUI) bearish sentiment remains near record lows as gold stocks are under performing gold which jumped on the surprise rate cuts which resulted in dumping of the dollar.
II. Dumb Money/Smart Money Indicators
The option-based Dumb Money/Smart Money Indicator as short/INT term (outlook 2 to 4 mns/weeks) and the Hedge Ratio below are the two most disconcerting indicators, reaching about the same level as the Sept 2018 pullback before the Oct high. If we do see a retest of the lows next week near SPX 2850 followed by a rally to the mid 3100s by late Mar, a SELL is likely pointing to the 2600s as the next target.
And the sister options Hedge Ratio sentiment has shown the weakest rise in bearish sentiment, remaining lower than any of the previous rallies over the last two years. Along with the ST Composite much more volatility is to be expected.
The INT term SPX Long Term (2x/DM) ETFs (outlook two to four weeks) bearish sentiment for the ETFs, in contrast to other indicators, has seen the strongest rise in bearish sentiment. This may be due to flight to safety by switching to bonds, but since this tends to be longer term compared to options, it is the main reason the correction may stretch out over most of the year with the biggest damage in the Fall.
The INT term NDX Long Term (2x/DM) ETFs (outlook two to four weeks) bearish sentiment has seen an almost identical rise to the SPX ETFs with same conclusions..
III. Options Open Interest
Using Thur closing OI, remember that further out time frames are more likely to change over time, and that closing prices are more likely to be effected. Delta hedging may occur as negative reinforcement when put support is broken or call resistance is exceeded. The SPX hedge spread (SPX puts - ETF calls) moderately positive, indicating that put support should hold. This week I will look out thru Mar 13 with an expanded range from 2800 to 3200. Also, This week includes a look at the GDX for Mar exp.
With Fri close at SPX 2972, options OI for Mon is small with very few calls below 3040 and almost all puts below 3000. Delta hedging may cause downward pressure, but rallies could be dynamic. No clear direction.
Wed is pretty much the same. No clear direction with downside potential to SPX 2800 and upside to 3060.
For Fri, large OI is likely to provide more upside pressure from put support where a hold over SPX 2900 could extend to 3060.
Using the GDX as a gold miner proxy closing at 29.4, even with gold pushing higher to 1680, GDX has been caught between put support at 27 and call resistance at 30. This month even much stronger call resistance was added at 32 to 34.

Currently the TLT is 166.8 with the TNX at 0.71%.
IV. Technical / Other
Just a quick look at two of the data mining indicators. First, the Crash Indicator that has improved sharply, but also very much like the Oct 2018 period, indicating that a tradeable bottom is near.
Secondly, the SPX hedge spread (SPX puts/ETF calls), indicating that put support is more likely to hold.
Conclusions. I am sure may were disappointed that I exited early, turning cautiously bearish on Dec 21 with the SPX at 3220 that resulted in missing about 5% of a 40% rally from 2350, but since I caught the exact bottom and foresaw a risk of a 30-40% loss back to 2000-2200s, the risk/reward was not worth it. With the SPX now at 2970, that still seems like a prudent decision. Sentiment works much better at timing bottoms than tops.
The next few weeks now show the potential for gaining an additional upside of about SPX 300 pts on a retest of the lows at 2850 to about 3150 to be followed by another possible downdraft of about 500 pts to 2600.
Weekly Trade Alert. Mon-Wed amy show some weakness after the Thur-Fri selloff of SPX 200 pts. A retest of the Feb lows at SPX 2855 should be a buying oppty thru EOM Mar, early Apr with a target of 3100-50. Unless there is a miraculous turnaround of China production, earning guidance for Q2 in Apr is likely to take a strong hit and could take the SPX to 2600s. Updates @mrktsignals.
Investment Diary, Indicator Primer,
update 2020.02.07 Data Mining Indicators,
update 2019.04.27 Stock Buybacks,
update 2018.03.28 Dumb Money/Smart Money Indicators
Article Index 2019 by Topic, completed thru EOY 2020.02.04
Article Index 2018 by Topic
Article Index 2017 by Topic
Article Index 2016 by Topic
Long term forecasts
© 2020 SentimentSignals.blogspot.com
Sentiment indicators are still conforming to the Oct 2018 setup, but still seem likely to play out over a longer time frame thru the EOY. Next week looks like a retest of the SPX 2850s is likely by mid-week with a rally to EOM at SPX 3100+ to follow. So far the 50% retracement level from the Feb high/lows (3124) has proved elusive with Wed close at 3130 and Tue brief spike to 3139. Bearish sentiment in the overall and ST composites indicate that the volatility is just beginning, while record sentiment in the INT 2x ETF SPX and NDX show that limited downside (SPX 2600) is likely for the next several months.
I. Sentiment Indicators
The overall Indicator Scoreboard (INT term, outlook two to four months) bearish sentiment has risen sharply since late Feb but has only reached the level of the first down leg in Oct 2018, truly a scary thought given the relative size of the decline.
The INT view of the Short Term Indicator (VXX $ volume and Smart Beta P/C [ETF Puts/Equity Calls], outlook two to four months) bearish sentiment has risen only moderately higher than seen in Aug 2019. Again, an amazing amount of complacency probably due to faith in the Fed's ability to solve all problems by printing money as well as Trump's probable re-election over the less that stellar Dem front runners.
Bonds (TNX). Somebody has to be wrong as bond investors seem to believe the end of the world is coming and at the current pace rate will reach 0% in two weeks time, while stock sentiment is giving the "all clear" signal.
For the INT outlook with LT still negative, the gold miners (HUI) bearish sentiment remains near record lows as gold stocks are under performing gold which jumped on the surprise rate cuts which resulted in dumping of the dollar.
II. Dumb Money/Smart Money Indicators
The option-based Dumb Money/Smart Money Indicator as short/INT term (outlook 2 to 4 mns/weeks) and the Hedge Ratio below are the two most disconcerting indicators, reaching about the same level as the Sept 2018 pullback before the Oct high. If we do see a retest of the lows next week near SPX 2850 followed by a rally to the mid 3100s by late Mar, a SELL is likely pointing to the 2600s as the next target.
And the sister options Hedge Ratio sentiment has shown the weakest rise in bearish sentiment, remaining lower than any of the previous rallies over the last two years. Along with the ST Composite much more volatility is to be expected.
The INT term SPX Long Term (2x/DM) ETFs (outlook two to four weeks) bearish sentiment for the ETFs, in contrast to other indicators, has seen the strongest rise in bearish sentiment. This may be due to flight to safety by switching to bonds, but since this tends to be longer term compared to options, it is the main reason the correction may stretch out over most of the year with the biggest damage in the Fall.
The INT term NDX Long Term (2x/DM) ETFs (outlook two to four weeks) bearish sentiment has seen an almost identical rise to the SPX ETFs with same conclusions..
III. Options Open Interest
Using Thur closing OI, remember that further out time frames are more likely to change over time, and that closing prices are more likely to be effected. Delta hedging may occur as negative reinforcement when put support is broken or call resistance is exceeded. The SPX hedge spread (SPX puts - ETF calls) moderately positive, indicating that put support should hold. This week I will look out thru Mar 13 with an expanded range from 2800 to 3200. Also, This week includes a look at the GDX for Mar exp.
With Fri close at SPX 2972, options OI for Mon is small with very few calls below 3040 and almost all puts below 3000. Delta hedging may cause downward pressure, but rallies could be dynamic. No clear direction.
Wed is pretty much the same. No clear direction with downside potential to SPX 2800 and upside to 3060.
For Fri, large OI is likely to provide more upside pressure from put support where a hold over SPX 2900 could extend to 3060.
Using the GDX as a gold miner proxy closing at 29.4, even with gold pushing higher to 1680, GDX has been caught between put support at 27 and call resistance at 30. This month even much stronger call resistance was added at 32 to 34.
Currently the TLT is 166.8 with the TNX at 0.71%.
IV. Technical / Other
Just a quick look at two of the data mining indicators. First, the Crash Indicator that has improved sharply, but also very much like the Oct 2018 period, indicating that a tradeable bottom is near.
Secondly, the SPX hedge spread (SPX puts/ETF calls), indicating that put support is more likely to hold.
Conclusions. I am sure may were disappointed that I exited early, turning cautiously bearish on Dec 21 with the SPX at 3220 that resulted in missing about 5% of a 40% rally from 2350, but since I caught the exact bottom and foresaw a risk of a 30-40% loss back to 2000-2200s, the risk/reward was not worth it. With the SPX now at 2970, that still seems like a prudent decision. Sentiment works much better at timing bottoms than tops.
The next few weeks now show the potential for gaining an additional upside of about SPX 300 pts on a retest of the lows at 2850 to about 3150 to be followed by another possible downdraft of about 500 pts to 2600.
Weekly Trade Alert. Mon-Wed amy show some weakness after the Thur-Fri selloff of SPX 200 pts. A retest of the Feb lows at SPX 2855 should be a buying oppty thru EOM Mar, early Apr with a target of 3100-50. Unless there is a miraculous turnaround of China production, earning guidance for Q2 in Apr is likely to take a strong hit and could take the SPX to 2600s. Updates @mrktsignals.
Investment Diary, Indicator Primer,
update 2020.02.07 Data Mining Indicators,
update 2019.04.27 Stock Buybacks,
update 2018.03.28 Dumb Money/Smart Money Indicators
Article Index 2019 by Topic, completed thru EOY 2020.02.04
Article Index 2018 by Topic
Article Index 2017 by Topic
Article Index 2016 by Topic
Long term forecasts
© 2020 SentimentSignals.blogspot.com
Subscribe to:
Posts (Atom)