
The past few days have brought the SPX very close to those levels. The question remains as to how the top will form. My preference is a pullback to the low 2700s next week, followed by a second top around the March optn exp on the 15th, then a second decline to the mid-2600s. Important news events are the Mueller results that may come out the next couple of weeks, the jobs report March 8th, and the FOMC March 19-20.
I. Sentiment Indicators
The overall Indicator Scoreboard (INT term, outlook two to four months) bearish sentiment dropped sharply last week reaching the SELL level for all but the longest EMA.
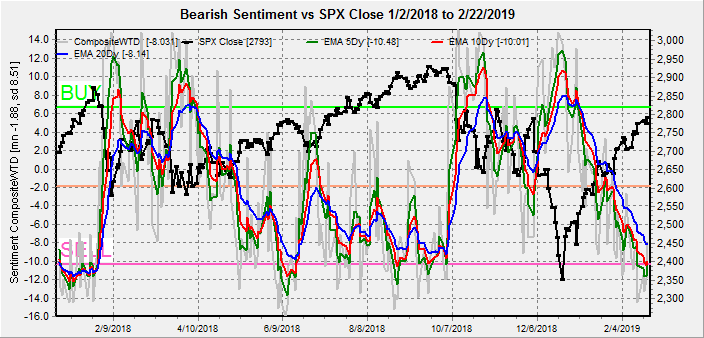
Comparing this to the 2014 analog, we have now reached the level close to the first double top in late Nov 2014.

The INT view of the Short Term Indicator (VXX+VXXB $ volume and Smart Beta P/C, outlook two to four months) bearish sentiment has also declined to SELL levels comparable to other significant tops in 2018.

Bond sentiment (TNX) is still looking like the Jun-Sep 2018 period where a three month consolidation was seen before a sharp runup in rates.

For the INT outlook with LT still negative, the gold miners (HUI) bearish sentiment has remained at low levels, but as seen in the past has not stopped rallies supported by a weaker US$ and low TNX rates.

And for the ST view, bearish sentiment remains above the SELL level so it is hard to say if a top is in.

II. Dumb Money/Smart Money Indicators
The Risk Aversion/Risk Preference Indicator (SPX 2x ETF sentiment/NDX ETF sentiment, outlook 2 to 4 mns/wks) as a INT indicator still shows strong risk preference that may limit advances and could be following a pattern from Oct-Nov 2018.

The option-based Dumb Money/Smart Money Indicator as short/INT term (outlook 2 to 4 mns/weeks) has been declining gradually that may indicate a longer topping period.

And comparing to the 2014 analog, we are still missing the sharp declines in sentiment seen before the Dec 2014 top.

While its sister sentiment indicator the Hedge Ratio, does show the sharper declines in sentiment that would be consistent with a somewhat more violent double top than what was seen in 2014.

The INT term SPX Long Term/Short Term ETFs (outlook two to four weeks) bearish sentiment still remains very low resulting from continued buying by dumb money (2x) while smart money (3x) remains neutral.

Long term neutral, the INT term NDX Long Term/Short Term ETF Indicator (outlook two to four weeks) as the long cycle seems to follow prices, the short cycle has remained at very low levels.

III. Options Open Interest
Using Thurs close, remember that further out time frames are more likely to change over time, more recently as shown with last weeks daily updates, more puts seem to be added one/two days before expiration. This week I will look out thru Mar 1.
With Fri close at SPX 2793, Mon looks like the most bullish day of the week with put support up to 2775 and call resistance ar 2800 and stronger at 2815. A push to 2810 could be reversed to below 2800 by the end of day. Light open int overall.
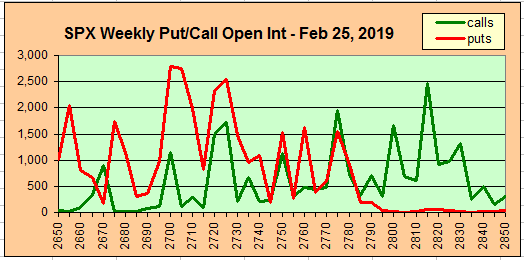
Wed has strong put support at SPX 2750 and 2710, and if SPX remains below 2800 call resistance could push prices to 2775 or lower.

For Thur EOM with very large open int, the overlaps at SPX 2725, 2750 and 2775 may allow prices to swing either up to 2800 or down to 2700 or below. Updates may clarify.

Fri currently has a very bearish outlook where call resistance is greater than put support above SPX 2700. The Mueller report was supposed to come out this week, but has been delayed, so I don't expect anything much below 2725.

IV. Technical Other
Comparing $SKEW to 2014, a similar rise occurred Dec-Feb 2018 as Oct-Sec 2014. note that the retest in SPX Aug 2015 did not occur until several months after the $SKEW retested its previous lows.

Conclusions. Sentiment is now at or near levels that indicate most of the rally off the Dec lows is over, but as was seen after the Oct 2014 and Aug 2015 lows several months of distribution are likely before a retest. The $SKEW compared to 2014 shows that a retest of the EMAs below 120 will probably proceed a retest. Options OI show that a high could occur early next week between SPX 2800-2815 and then decline sharply thru the end of week. Possibly, with the China trade deadline scheduled for Mar 1, lack of concrete agreements may lead to a set back in stock prices.
Weekly Trade Alert. Heads up for some potential volatility with a Mon/Tue high above SPX 2800 followed by a decline toward the 2720s. Updates @mrktsignals.
Investment Diary, Indicator Primer, update 2018.03.28 Dumb Money/Smart Money Indicators
Article Index 2019 by Topic
Article Index 2018 by Topic
Article Index 2017 by Topic
Article Index 2016 by Topic
Long term forecasts
© 2019 SentimentSignals.blogspot.com
No comments:
Post a Comment