
Looking back at the last V-bottom in the SPX of Oct 2014, the stock market rallied for about 6 weeks to within 2-3% of the May 2015 high without a significant pullback. If this is a B-wave targeting SPX 2800-2900, that could be a price target of 2725-2825. Looking at the sentiment indicators for that period, both the Indicator Scoreboard and ST Indicators reached a SELL in Dec 2014 before the first 3-5% pullback. Other indicators varied widely. So just in case, it may be wise to be cautious if you are bearish. My feeling is still that there is a significant risk that the China trade talks will go nowhere for several months before Trump pulls the nuclear option (25% tariffs, sanctions) late summer/early fall.
I. Sentiment Indicators
The overall Indicator Scoreboard (INT term, outlook two to four months) bearish sentiment continues to decline and has now reached the level of mid May 2018 where a two week consolidation was seen before a brief pullback.

Looking at the Oct 2015 V-bottom, 2019 sentiment is at about the level 1% from the early Dec high preceding a two week consolidation high then a 3-5% pullback.

The INT view of the Short Term Indicator (VXX+VXXB $ volume and Smart Beta P/C, outlook two to four months) bearish sentiment is also at the level of mid May 2018. (Note, the the VXX stopped trading on the 29th and it appeared that there was additional volume due to traders switching products the last 10 trading days, so a volume adjustment was made to back out the extra volume with results shown below where VXX $ Vol and Smart Beta P/C sentiment were aligned. Details under Tech/Other)
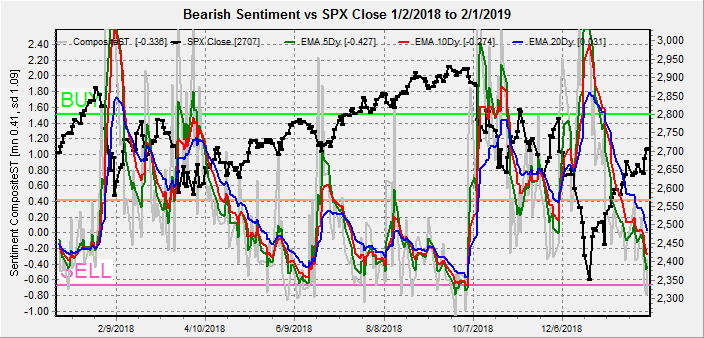
Looking at the Oct 2015 V-bottom, 2019 sentiment is also at a similar level preceding a two week consolidation high then a 3-5% pullback.

Bond sentiment (TNX) is still looking like the Jun-Sep 2018 period where a three month consolidation was seen before a sharp runup in rates.

For the INT outlook with LT still negative, the gold miners (HUI) bearish sentiment remains moderately negative as gold stocks/gold remain captive to the trend in the US $.

II. Dumb Money/Smart Money Indicators
The Risk Aversion/Risk Preference Indicator (SPX 2x ETF sentiment/NDX ETF sentiment, outlook 2 to 4 mns/wks) as a INT indicator has seen a sharp drop in bearish sentiment for the NDX relative to the SPX.
Looking at the NDX relative to the Risk Aversion/Risk Preference Indicator, now equal to the NDX 7400 level seen in Aug 2018. The NDX is expected to under perform as seen on Fri.

The option-based Dumb Money/Smart Money Indicator as short/INT term (outlook 2 to 4 mns/weeks) also saw a sharp drop last week and is also at the level of the mid May 2018 consolidation.

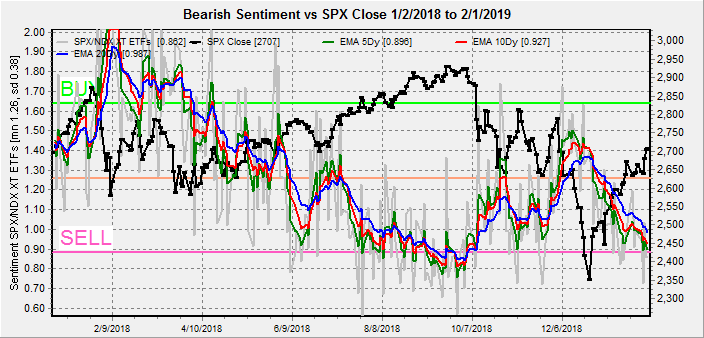
The INT term SPX Long Term/Short Term ETFs (outlook two to four weeks) bearish sentiment saw a very sharp drop last week as dumb money continued to buy but smart money turned neutral, again similar to mid May 2018.

Long term neutral, the INT term NDX Long Term/Short Term ETF Indicator (outlook two to four weeks) as the long cycle seems to follow prices, the short cycle has moved to mid way neutral/SELL.

III. Options Open Interest
Using Thurs close, remember that further out time frames are more likely to change over time. This week I will look out thru Feb 15.
With Fri close at SPX 2707, Mon. Light open int overall. Shows no SPX support until 2680-90 and light call resistance at 2730.

Wed is similar with higher call resistance up to SPX 2730, but little above. Possibly more downward pressure if prices stay below 2730.

Fri, larger open int dominated by calls with no clear directionality. Inflection pts at SPX 2650, 2700, and 2760. Below SPX 2700 could drop to 2660.

Fri, optn exp, SPX PMs. This seems to be the most bearish due to the lack of put support, but like the Nov-Dec period, prices have outrun options positions. Best guess is that over SPX 2670, 2740 is possible, but below 2670, 2600 is possible.

And for SPY, conclusion is similar with 260, 270 and 276 major inflection pts.

IV. Technical / Other
Compared to the Feb 2018 decline and retest, the SPX/TNX sentiment comparison shows that bondholders have not begun to move into stocks. Since bondholders are usually the last ones to join the party, there should be plenty of time, if not price, left in the rally phase. Now equal to the Mar-Apr 2018 period.

Comparing the Short Term Indicator components VXX+VXXB $ volume and Smart Beta P/C,
with the adjustments noted above, both indicators are at almost identical levels.


Conclusions. Last week saw the SPX rally back from the depths of a "bear market" to recapture both the 100 SMA and 62% retracement at 2715 with a 16% rally in 5 and a half weeks. As noted above a similar V-bottom rally occurred in Nov 2014 with striking similarities in sentiment. In early Dec 2014, the rally reached a high after 7.5 weeks before a 3-5% pullback after the Indicator Scoreboard and ST Indicator reached the SELL levels. What could follow is a two week consolidation high with an additional 1-2% higher levels (SPX 2725-50) before a pullback to 2600-50.
Overall sentiment supports an extended topping period similar to the first half of 2015 with limited upside. The SPX/TNX sentiment is comparable to Mar-Apr 2018 as bondholders have not moved into stocks. The ETF indicators, namely the Risk Aversion/Risk Preference Indicator and SPX Long Term/Short Term ETFs never reached the strong BUY level seen at the Feb 2018 lows, so ATHs are not expected in the SPX or NDX, supporting the large B-wave scenario. With an active PPT (dovish Fed) and high Risk Preference for NDX, the DJIA may outperform and could reach or test the ATH of 27k as it is the easiest to manipulate.
Weekly Trade Alert. Volatility may pick up in the range of SPX 2700-50, but a larger correction of 3-5% is not expected until Feb 15 optn exp/indicator SELLs. Updates @mrktsignals.
Investment Diary, Indicator Primer, update 2018.03.28 Dumb Money/Smart Money Indicators
Article Index 2018 by Topic
Article Index 2017 by Topic
Article Index 2016 by Topic
Long term forecasts
© 2019 SentimentSignals.blogspot.com
No comments:
Post a Comment