
One notable weakness is the narrowness of the advance, which I pointed out would be shown with the DJIA leading the way (PPT support) while the broader averages (SPX) lags. One surprise Mon/Tue was strength in the NDX, but this was caused by only a handful of stocks (AAPL) and faded quickly as the week progressed. Friday the DJIA did catch up to the downside.
I am not sure how many noticed the change in the GOPs approach to upcoming China trade talks, but for the past six months we have seen a pattern of "happy talk" via Trump tweets and other pre-announcements which ended getting investors excited, thereby bidding up prices, only to find prices crashing down even further after post-announcement realities. Last Thur's AM pre-announcement that things weren't going so well put a damper on the unstoppable rally, but may actually reduce overall volatility going forward. I expect March to come and go with no material change in China trade talks, but no action on additional tariffs is likely to let the market limp forward for a few months.
I. Sentiment Indicators
The overall Indicator Scoreboard (INT term, outlook two to four months) bearish sentiment is still following a similar pattern to May 2018 where a two week consolidation/pullback was seen between SPX 2700-50.

The INT view of the Short Term Indicator (VXX+VXXB $ volume and Smart Beta P/C, outlook two to four months) bearish sentiment is also following a similar pattern to May 2018.

Bond sentiment (TNX) is still looking like the Jun-Sep 2018 period where a three month consolidation was seen before a sharp runup in rates.

For the INT outlook with LT still negative, the gold miners (HUI) bearish sentiment remains near the lower extreme.

Looking at the ST gold miners (HUI) bearish sentiment from the last half of 2018 shows that the miners have been following the ST trend that appears to be topping.

The Risk Aversion/Risk Preference Indicator (SPX 2x ETF sentiment/NDX ETF sentiment, outlook 2 to 4 days/wks) as a INT indicator is showing very strong preference for the risky NDX that was last seen in Aug 2018. This may be indicating a late stage of the advance.

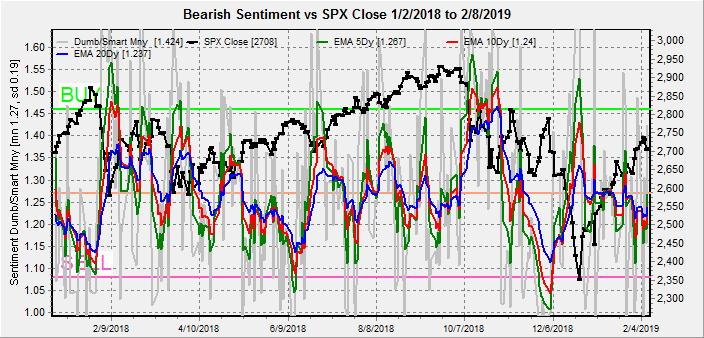
The option-based Dumb Money/Smart Money Indicator as short/INT term (outlook 2 to 4 days/weeks) is also following a similar pattern to May 2018.
The INT term SPX Long Term/Short Term ETFs (outlook two to four weeks) bearish sentiment has reached an extreme low level first on Wed when strong buying by dumb money (2x) was matched with neutral smart money (3x) and again on Thur when dumb money was weak sellers and smart money was strong sellers. Since neither is at a SELL level, I am considering this as more of an anomaly.

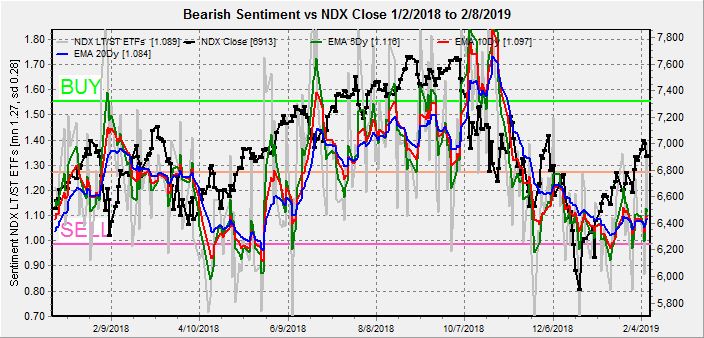
Long term neutral, the INT term NDX Long Term/Short Term ETF Indicator (outlook two to four weeks) as the long cycle seems to follow prices, the short cycle has bounced back from the low bearish levels.
III. Options Open Interest
Using Thurs close, remember that further out time frames are more likely to change over time. This week I will look out thru Feb optn exp. I've noticed the past week that very ST put positions have been added one/two days before expirations (see Twitter updates), so there is a greater than usual chance that new put support will be added.
With Fri close at SPX 2708, Mon, if SPX falls below 2700, the next put support level is 2670, but there is very little call resistance until 2750. Light open int overall.

Wed, if SPX is over 2700, put support could push prices to 2730 with little call resistance until 2750. Below 2700 and 2660 is next support. Light open int overall.

Fri, optn exp, SPX AM is potentially more bearish with call resistance at SPX 2700 and higher. Large put and call positions at 2650 may cause that level to act as a magnet with strong put support at 2600. Large open int overall.

Fri, optn exp, SPX PM is also bearish with 2670-75 likely an attraction area with put support at 2625 and call resistance at 2775. Light open int overall.

Conclusions. I had been expecting a tradeable top next week with a standard 38% retrace comparable to the Dec 2014 decline of 42% into late Feb 2019, but the ETF DM/SM indicators are suggesting that the remainder of the rally may be more like Jul-Oct 2018 with only 2-3% pullbacks and a top sooner than expected. Trying to reconcile this with the macro picture, it's likely March will prove to be a standoff on China trade with a timeline extension and no new tariffs that may be viewed positively with Fed pausing rate hikes. This may push the SPX 100-150 pts higher by summer.
Weekly Trade Alert. With most of the sentiment similar to the May 2018 time period, a closer look at the SPX 2018 price levels shows a two week consolidation/pullback that is consistent with a slightly higher high (2740+) next week Tue/Wed followed by a somewhat stronger pullback (2650ish) into early the following week. Updates @mrktsignals.
Investment Diary, Indicator Primer, update 2018.03.28 Dumb Money/Smart Money Indicators
Article Index 2018 by Topic
Article Index 2017 by Topic
Article Index 2016 by Topic
Long term forecasts
© 2019 SentimentSignals.blogspot.com
No comments:
Post a Comment