
With China, the problem is not with natural resources, but with the supply of manufactured goods as China produces 30-40% goods worldwide from apparel to electronics. The work stoppage so far has only been a couple of weeks, but it's doubtful if production will return to normal levels for months due to virulent spread of the coronavirus. The result of less supply will likely be higher prices, particularly in consumer goods such as those sold in Walmart, so the middle class will be hardest hit. The Fed is not going to be able to solve the problem by printing money.
The stock market seems to be entering a panic buying mode as seen before many important tops, but there are no sentiment indications of an immediate downturn of any significance. The Tech/Other section looks at two LT indicators.
I. Sentiment Indicators
The overall Indicator Scoreboard (INT term, outlook two to four months) bearish sentiment fell sharply last week as the SPX rallied to new highs, but at this time does not indicate that a top is in place.

The INT view of the Short Term Indicator (VXX $ volume and Smart Beta P/C [ETF Puts/Equity Calls], outlook two to four months) bearish sentiment also fell, now nearing the SELL area, as the Smart Beta P/C did reach a SELL.

Bonds (TNX). Interest rates continued to inch downward as bearish sentiment remains at record lows. This is one reason why I find the supply shock/stagflation interesting since higher inflation with lower growth would maintain a floor on rates while providing a negative real return to bond holders.

For the INT outlook with LT still negative, the gold miners (HUI) bearish sentiment is also at record low levels and upside is likely to be hampered if growth slows.

II. Dumb Money/Smart Money Indicators
The option-based Dumb Money/Smart Money Indicator as short/INT term (outlook 2 to 4 mns/weeks) remains below neutral as this showed little movement with the 4% pullback two weeks ago (probably due to the short duration and quick recovery), and is likely to limit upside.

And the sister options Hedge Ratio sentiment is similar but the sharpness of the decilne did cause hedging to rise above neutral.

The INT term SPX Long Term (2x/DM) ETFs (outlook two to four weeks) bearish sentiment was shown last week to be the most bearish and the rise in SPX was likely due to short covering with a decline in sentiment down to neutral.

Somewhat puzzled by the continued strength in the NDX, I decided to look at the INT term NDX ST Term (3x/SM) ETFs (outlook two to four weeks) bearish sentiment rose much more sharply than the 2X (similar to SPX 2x) and was probably due to the proximity to the megaphone target. Unlike the smart money that correctly went from long to short late 2018, this time the bears appear to be the dumb money and have been consistently wrong since Dec 2018.

III. Options Open Interest
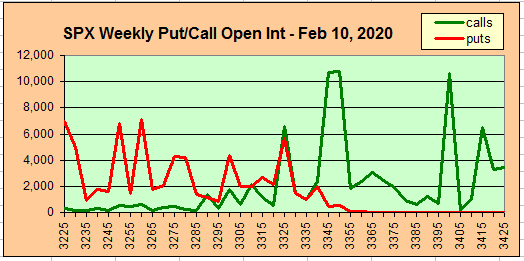
Last week I had been expecting more of a consolidation with a pullback to SPX 3300 possible, but I noticed something in the Mon Twitter update that hinted of possible strength. A couple of years ago I noticed something I called the "new options" effect mentioned in the Investment Diary as a notice to day traders. The idea is that large banks like GS may front run a large trade for an institution by taking an options position before the order is placed, as well as hedge funds that may use a similar tactic to offset a "price effect". On Mon the SPX opened at 3317 on China nCoV news, but then quickly ramped up to 3340 before a last hour rally to 3352. Notice the 11K calls at 3345 and 3350 on Fri close, where the Thur close showed 2k.
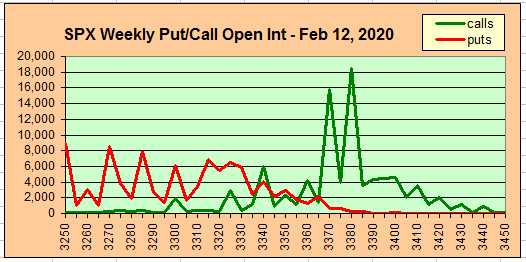
We also saw something similar on Wed at 3370 and 3380 where the earlier positions of 1-3K were increased to 16-18K. (About the same time in 2018 someone asked me to post the Excel spreadsheet which is still on Google drive with limited instructions here.)
Using Thur closing OI, remember that further out time frames are more likely to change over time, and that closing prices are more likely to be effected. Delta hedging may occur as negative reinforcement when put support is broken or call resistance is exceeded. The SPX hedge spread (SPX puts - ETF calls) remains lightly positive, indicating that call resistance/put support should hold. This week I will look out thru Feb 21. Also, this week includes a look at the GDX for Feb exp.
With Fri close at SPX 3380, options OI for Tue are small, but show increasing resistance at 3375 and above, with support at 3300. Some pullback is possible.

Wed has somewhat larger OI where SPX shows some support at 3350 and resistance 3375. A pullback to 3350 seems likely.

For Fri, moderate OI with call resistance starting at SPX 3335. SPX 3360 is probably an important pivot as above will cause delta hedging to support prices, while below makes 3325 a likely target. Put support begins at 3300.

For the EOM Fri 28 with large OI, the setup is similar to Fri where the longer term OI is mostly calls but put support will likely be added if there is a pullback next week. Otherwise, the likely range is 3325-75.

Using the GDX as a gold miner proxy closing at 28.3 remains locked into a range of 28-9 with large puts at 27 and calls at 30.
Currently the TLT is 144.6 with the TNX at 1.59% and remains biased to the upside with firm put support at 142 and little call resistance until 146..

IV. Technical / Other
As a quick note on the data mining indicators, the Equity P/C spread remains modestly positive, with VIX P & C spreads neutral while SPX hedge spread is slightly negative.
For the LT outlook, NYUPV/NYDNV continues to mimic 2015 and 2018.

Looking thru my archive, I found an interesting trend in the ADLINENYC. Going back to 2018, the AD line typically leads prices higher with corrections starting when the line rolls over. In Jan 2018, SPX continued higher creating a large divergence that was followed by a violent reversion, while in Sept-Oct the rollover was concurrent.

A closer look shows the SPX currently in between the two previous tops.

Conclusions. Equity P/C spread still shows smart money is still long compared to other options traders and the NDX 3X ETFs indicates that high bearish sentiment will be a short term positve, while other sentiment is less bearish than last week, but not extremely so. Most EW analysts are looking at an ending diagonal that should result in a retest of the late Jan lows, but sentiment supports more of a trading range with positive bias for NDX. The chart below is consistent with Trader Joe's interpretation, but I am still expecting a Mar high.

Weekly Trade Alert. More consolidation seems most likely, but a late week pullback of 1-2% is possible with continued sentiment deterioration. Updates @mrktsignals.
Investment Diary, Indicator Primer,
update 2020.02.07 Data Mining Indicators,
update 2019.04.27 Stock Buybacks,
update 2018.03.28 Dumb Money/Smart Money Indicators
Article Index 2019 by Topic, completed thru EOY 2020.02.04
Article Index 2018 by Topic
Article Index 2017 by Topic
Article Index 2016 by Topic
Long term forecasts
© 2020 SentimentSignals.blogspot.com
Another high quality analysis! Look forward to the next Saturday edition!
ReplyDelete