
Some seem to think that the volatility will continue with a retest of the lows or lower next week, but comparing similar sentiment behavior to mid-2015 and mid-2018, the topping period may extend out for another 4-6 months. In particular, the Tech/Other section takes a look at three of the data mining indicators that gave strong warnings before the Aug 2015 flash crash.
I have finally been able to catch up with the article index for 2019 and have also completed an additional section in the Investment Diary for the usage and interpretation of the data mining indicators that may be of special interest to new readers. See the appendix for links.
I. Sentiment Indicators
The overall Indicator Scoreboard (INT term, outlook two to four months) bearish sentiment briefly spiked with the n-coV scare, but has now fallen below neutral similar to July 2018.
The INT view of the Short Term Indicator (VXX $ volume and Smart Beta P/C [ETF Puts/Equity Calls], outlook two to four months) bearish sentiment has remained below neutral and is warning of more volatility.
Bonds (TNX). Interest rates continued to fall last week with extremely low bearish sentiment. The Safety Trade Indicator was little changed.

For the INT outlook with LT still negative, the gold miners (HUI) bearish sentiment also remains extremely low while prices retreated. The n-coV breakout in China seems to have taken a bite out of inflation expectations, even though gold remains stable.

II. Dumb Money/Smart Money Indicators
The option-based Dumb Money/Smart Money Indicator as short/INT term (outlook 2 to 4 mns/weeks) bearish sentiment seems to be starting a rising channel as seen from Jult-Oct 2018 and may indicate a continuation of the rally for several months.

And the sister options Hedge Ratio sentiment is showing even stronger relative hedging, but much lower than July 2018. Perhaps limited upside of 2-3%

The INT term SPX Long Term (2x/DM) ETFs (outlook two to four weeks) bearish sentiment rose the strongest of all indicators, matching the Aug and Oct 2019 pullbacks, and may support a multi-month uptrend.

The INT term NDX Long Term (2x/DM) ETFs (outlook two to four weeks) bearish sentiment rose to the levels of the Oct 2019 pullback, but is much weaker than the SPX ETFs.

III. Options Open Interest
Using Thur closing OI, remember that further out time frames are more likely to change over time, and that closing prices are more likely to be effected. Delta hedging may occur as negative reinforcement when put support is broken or call resistance is exceeded. This week I will look out thru Feb 14. Also, This week includes a look at the GDX for Feb exp.
The SPX hedge spread (SPX puts - ETF calls) turned negative last week, indicating that call resistance should hold, while put support may not.

With Fri close at SPX 3328, options OI for Mon may understate put support due to Fri decline, but currently show net call resistance down to 3300 with put support starting at 3275.

Wed is much the same, where SPX shows a likely range of 3275-3325 with a slightly positive bias.

For Fri, has larger OI and call resistance at 3310 and higher should keep prices below that level. SPX 3275 is critical as large call OI could pressure prices below it with next support at 3250.

Looking at the EOM Feb 28, here we see very strong call resistance at SPX 3300 and above, although a move over 3300 may pressure prices toward 3350 with delta hedging. Put support has tended to be added at the last minute, but 3275 seems to be the most likely support level.

Using the GDX as a gold miner proxy closing at 27.9, down about 4% the last two weeks. Gold bugs have touting this as the strongest seasonal period but prices don't agree. Options OI remains unchanged with strong call resistance at 30 and put support at 27.

Currently the TLT is 144.4 with the TNX at 1.58% as rates fell and prices rose, mostly on Fri.
IV. Technical / Other
This week I want to take a look at the markets action following the May 2015 high and before the Aug "flash crash" where the SPX dropped more than 10% in a matter of days. I am not expecting a repeat, but Jan 23 I used the May 2015 analog to predict a 4% drop followed by an ATH retest,and the results were only slightly stronger than expected. Now it seems as we have a combo of the Jul-Oct 2018 uptrend and the mid-2015 topping process. The result would be a 4-6 month topping process before a 10%+ decline.
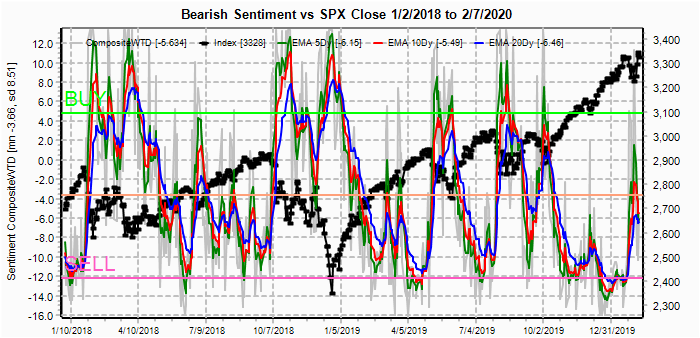
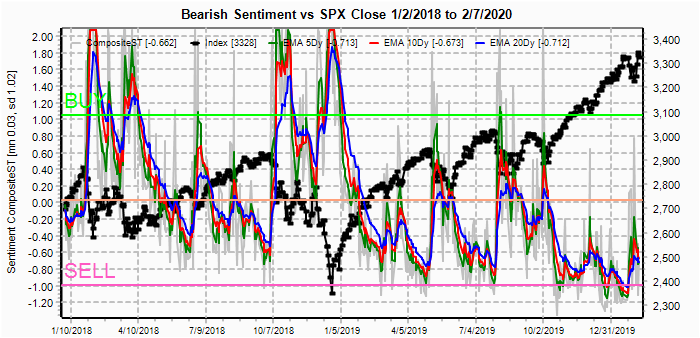
Taking a 1 year look at 2015 with various indicators, three stood out as timing tools. The first which we saw with a SELL mid Jan 2020 is the VIX Call Indicator. In 2015, there was a SELL at the May top followed with an initial decline comparable to the n-CoV scare two weeks ago that was followed by an ATH retest. The ATH retest produced another SELL about a month later which was followed by a lower low. Repeat with another ATH retest and SELL and several weeks later the Aug "flash crash". Each of the SELLs became increasing stronger as well as the following downside. Since this analog has been running on a 2X timeline, this would mean about 2 months between each selloff.

The second indicator is the Equity P/C spread to CPC Revised (see Investors Diary). although not perfect, the spread (blue) is positive when Equity options buyers are more bullish than others and negative when less so. The idea is that when the spread falls to neutral or below that is a warning of a potential decline since Equity P/C represents "smart money". In particular note the sharp decline in the spread prior to the late June and mid-Aug selloffs.
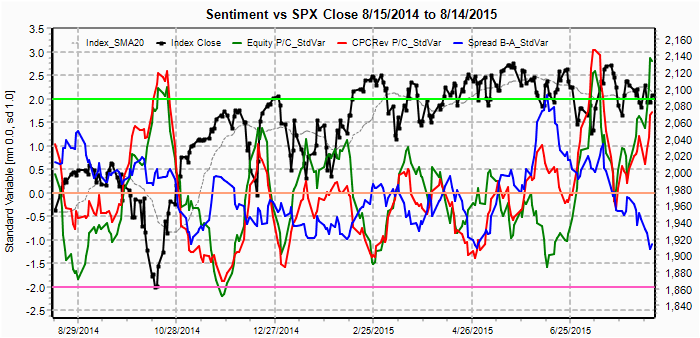
Finally, the SPX hedge spread (SPX puts - ETF calls). After being positive for most of the year prior to the May top, the spread became increasingly negative prior to the Aug "flash crash".

Conclusions. Sentiment is predicting a somewhat confusing picture. ST SPX options OI is indicating that the rest of Feb may be a consolidation period with as much as a 50-62% retracement of last weeks rally to 3250-75 with continued volatility. INT indicators currently show that more/but limited upside is likely over a several month period. My best guess is a continuation higher in Mar, possibly to SPX 3370, then a larger decline in Apr-early May to 3150-70. If we then see bears chanting "crash, crash, crash, sell in May", a summer rally will begin. I am wary, however, of the start of a 2007-09 analog where a 10% decline in July-Aug leads to an Oct-Nov ATH.
Weekly Trade Alert. Pullback likely next week. Strong put buying Fri does not show up in OI data and may limit decline to 3275-3300. Updates @mrktsignals.
Investment Diary, Indicator Primer,
update 2020.02.07 Data Mining Indicators,
update 2019.04.27 Stock Buybacks,
update 2018.03.28 Dumb Money/Smart Money Indicators
Article Index 2019 by Topic,
Article Index 2018 by Topic
Article Index 2017 by Topic
Article Index 2016 by Topic
Long term forecasts
© 2020 SentimentSignals.blogspot.com
No comments:
Post a Comment