
One a positive note, the impeachment trial of Trump seems to be drawing to a close with an acquittal by the Senate possible on Wed. SPX options OI shows possible downside follow thru Mon to the SPX 3200 level with the 50 SMA at 3211, but large put positions on Wed at 3255 are likely to cause a sharp mid week rebound.
Volume indicators (Tech/Other) show that the SPX may be at/near at least a ST bottom.
I. Sentiment Indicators
The overall Indicator Scoreboard (INT term, outlook two to four months) bearish sentiment has now risen about the same amount, but from a lower level, as seen in July 2018 and may support a moderate rally.

The INT view of the Short Term Indicator (VXX $ volume and Smart Beta P/C [ETF Puts/Equity Calls], outlook two to four months) bearish sentiment also saw a decent pop with an increase in ETF hedging, but is at a level where volatility is likely to remain high.

Bonds (TNX). Interest rates continued to fall along with bearish sentiment with rates at 1.5% nearing a possible double bottom at 1.4%.

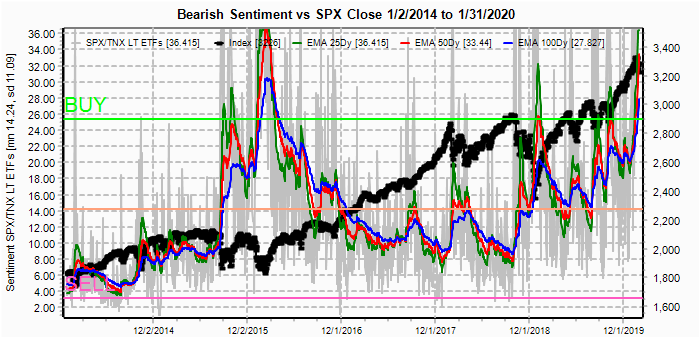
Also, the LT Safety Trade Indicator (SPX/TNX ETFs) saw a large spike with a strong move into bonds, usually preceding a bottom in stocks, and is now approaching the levels seen on the Feb 2016 lows. Could this presage a rally into the election if the coronavirus is contained?
For the INT outlook with LT still negative, the gold miners (HUI) bearish sentiment continues to fall, but the HUI 240/GDX 30 continues to be a hard nut to crack.

II. Dumb Money/Smart Money Indicators
The option-based Dumb Money/Smart Money Indicator as short/INT term (outlook 2 to 4 mns/weeks) saw a moderate move up, but nothing to support a sustained rally.

And the sister options Hedge Ratio sentiment continues to track the DM/SM indicator with the same conclusions.

The INT term SPX Long Term (2x/DM) ETFs (outlook two to four weeks) bearish sentiment has moved up sharply, matching the early Oct 2019 level, but not matching INT lows of Feb and Dec 2018.

The INT term NDX Long Term (2x/DM) ETFs (outlook two to four weeks) bearish sentiment is much the same as the SPX with similar conclusions.

III. Options Open Interest
Using Thur closing OI, remember that further out time frames are more likely to change over time, and that closing prices are more likely to be effected. Delta hedging may occur as negative reinforcement when put support is broken or call resistance is exceeded. The SPX hedge ratio (SPX puts/ETF calls) remains slightly positive, indicating that put resistance should hold. This week I will look out thru Feb 7. Also, This week includes a look at the TLT for Feb exp.
First a look at last Fri which is similar to next Fri. The hedged (straddles) OI at 3250 and 3275 offered little resistance, but the support at 3225 was able to hold prices at the close.

With Fri close at SPX 3226, options OI for Mon shows moderate size with call resistance at 3230 and little put support until 3200 (Fri selloff may have increased put support), so a move down to or below 3200 seems likely.

Wed has similar size OI where SPX shows moderate put support up to 3255 and little call resistance until 3300, setting up the possibility of a sharp mid week turnaround with Wed currently scheduled to announce the results of Trumps impeachment.

For Fri, large OI may influence weekly behavior, as strong put support is seen at 3250 with little call resistance until 3300 and 3325 where partial hedges exist.

Also, I am thinking about adding the SPX EOM as a longer term outlook since this usually has relatively large OI and is hedged less than the optn exp AM OI. The region from SPX 3225 and below shows strong put support, with 3250 and 3275 hedged and 3300 strong call resistance. Prices should end up between 3225 and 3300.

Using the GDX as a gold miner proxy closing at 28.99 as call resistance at 30 continues to hold.
Currently the TLT is 145.9 with the TNX at 1.52%. My conclusions two weeks ago about the straddles at 138 and 140 proved incorrect as little resistance was provided for a move higher and now the area of 143-148 shows only small call resistance.

IV. Technical / Other
A look at the current NYUPV/NYDNV volume chart since 2015 shows that we are now in similar positions as seen in the Jul 2015 and Sept 2018 pullbacks.
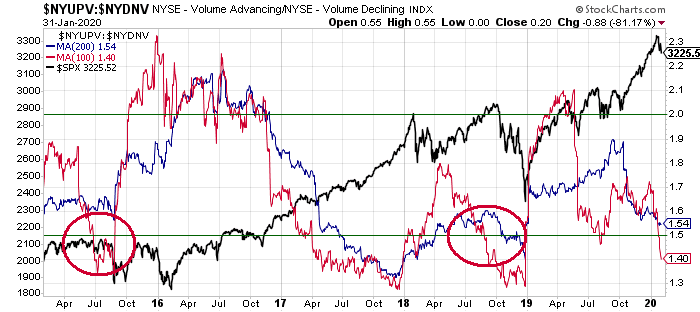
While the capitulation indicator (down volume/declining issues) is at panic levels, matching July 2018 and Dec 2018 lows.

The A/D volume (NYUD) is also at extreme levels.

Conclusions. Further downside is likely ST, with the SPX options OI showing that Mon may a drop down to/or below 3200, while mid week is setup for a rebound that could bounce over 3255 if Trump is acquitted at his impeachment hearing where results are scheduled for Wed. Longer term sentiment does not show the potential for much more than a bounce and volatility is likely to continue with a likely range of SPX 3200-3300 as long as the effects of the coronavirus are mostly contained to China.
Weekly Trade Alert. Most likely down to SPX 3200 then up to 3260 mid week, but with little follow thru to the upside. Updates @mrktsignals.
Investment Diary, Indicator Primer, update 2019.04.27 Stock Buybacks, update 2018.03.28 Dumb Money/Smart Money Indicators
Article Index 2019 by Topic
Article Index 2018 by Topic
Article Index 2017 by Topic
Article Index 2016 by Topic
Long term forecasts
© 2020 SentimentSignals.blogspot.com
Thanks Arthur. A squeeze is certainly looking likely at some point this week, and Wednesday's impeachment results would be a great catalyst to start it. I don't know where it will stop out though as if enough bears short the 3250-3260 area it might go higher to squeeze them out.
ReplyDeleteI've just noticed that when some level is very obvious (like a 50% Fib level) it tends to go past it, or falls short of it. But with that news coming out on Wednesday that's likely going to be a reason to go higher then normal I think, versus falling short. Just a gut feeling but I wouldn't be shocked to see 3300 hit if the shorts pile on midway up the rally.
.50c trader making 17 million. He took some profit. But increased his positions for march vix. I read somebody bought big amount of box calls for this wednesday
ReplyDeleteVix
ReplyDelete100k vix calls for Feb 22. .45. I am not able bring up vix options. When I type in vix
ReplyDelete