Last week was expected to test/exceed the SPX 3300+ area by mid-week before an expected pullback no later than Fri. The pullback materialized for the mega cap tech stocks on Fri with the "better than expected" jobs data, but a rotation into the more cyclical areas boosted the broader averages. Surprisingly, there was little market reaction to disappointment on the lack of Congressional approval of even a $1T stimulus package and more delays expected due to signs of an improving economy. Trump continues to push back against China as this now seems to be the only sign of progress made the last four years as trade talks seem to be falling apart.
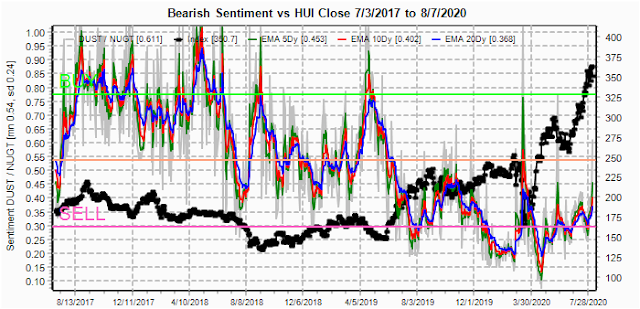
Next week may be the start of a short but sharp pullback of up to 200 SPX pts, now possibly to the 3150 area. For this weeks sentiment indicators, I have back tracked to mid-2017 to look at the lead in to the Jan 2018 top, but July-Sept remains the most likely analog. The VIX term structure has remained over 1.2 for most of the last two weeks, now forming a "cluster" as seen as previous INT tops (Tech/Other update).
Although I have not done much coverage of gold/GDX, looking thru some of my archived charts I found a couple of charts from two years ago that still fit the current blow off compared to int rates.
The overall Indicator Scoreboard (INT term, outlook two to four months) bearish sentiment is now approaching the low levels seen late Dec 2019, a few weeks before the Mar crash.
The INT view of the Short Term Indicator (VXX $ volume and Smart Beta P/C [ETF Puts/Equity Calls], outlook two to four months) bearish sentiment is still lagging behind due to the level of VXX $ Vol remaining relatively high.
The option-based Dumb Money/Smart Money Indicator as short/INT term (outlook 2 to 4 mns/weeks) bearish sentiment has now fallen to the lowest level seen over the last three years.
Using Thur closing OI, remember that further out time frames are more likely to change over time, and that closing prices are more likely to be effected. Delta hedging may occur as reinforcement, negative when put support is broken or positive when call resistance is exceeded. This week I will look out thru Aug 14 and EOM for SPX. Also, this week includes a look at the GDX for Aug exp.
With Fri close at SPX 3351, options OI for Mon show very little put support until 3250 with modest call resistance at 3350 and 3360. The 3320 level may be touched sometime during the day, with either a strong AM to 3360 with a late fade, or an early "news related" selloff, followed by a rally to 3350-60 then fade.
Currently the TLT is 170 with the TNX at 0.56%.
IV. Technical / Other
The most consistent of the data mining indicators from the mid-2017 time frame are the Equity P/C indicators, so I just wanted to take a quick look. First, the Equity P/C and SKEW spread show consistently lower readings followed by larger INT corrections since Feb 2018.
Weekly Trade Alert. Mon may see a possible ST top around 3360 with a likely pullback toward 3150 that could end up being a chop fest into the EOM. Updates @mrktsignals.
Investment Diary, Indicator Primer,
update 2020.02.07 Data Mining Indicators,
update 2019.04.27 Stock Buybacks,
update 2018.03.28 Dumb Money/Smart Money Indicators
Article Index 2019 by Topic, completed thru EOY 2020.02.04
Article Index 2018 by Topic
Article Index 2017 by Topic
Article Index 2016 by Topic
Long term forecasts
© 2020 SentimentSignals.blogspot.com


No comments:
Post a Comment