The next two weeks will host the National Conventions for the US Presidential candidates with the Dems squaring off next week Mon-Thur and the GOP the following week. Interestingly, there is some evidence that Wall Street may try to indicate favor by having a pullback of SPX 100+ pts next week then a rally to 3400+ the last week of Aug to show favor for Trump. This also fits Trader Joe's outlook for a w4 pullback to about 3250.
This week I will take a look at the SPX and NDX LT (2x) ETFs as a gauge of future performance as well as adding the QQQ as a measure of NDX options OI.
Overall sentiment indicates that an INT top of some importance is very near, but still may need several weeks for a top to complete.
The overall Indicator Scoreboard (INT term, outlook two to four months) bearish sentiment has now eclipsed the lows seen in Jan 2020, but seem to be following the pattern of increasingly low sentiment for each INT top since Oct 2018.
The INT view of the Short Term Indicator (VXX $ volume and Smart Beta P/C [ETF Puts/Equity Calls], outlook two to four months) bearish sentiment is also testing its lows since 2018, but remains somewhat higher due to continued bearish positions in volatility products.
The option-based Dumb Money/Smart Money Indicator as short/INT term (outlook 2 to 4 mns/weeks) is reaching the "scary" levels with the lowest LT EMA (bl) and ST only exceeded by the Dec 2018 pre-crash level.
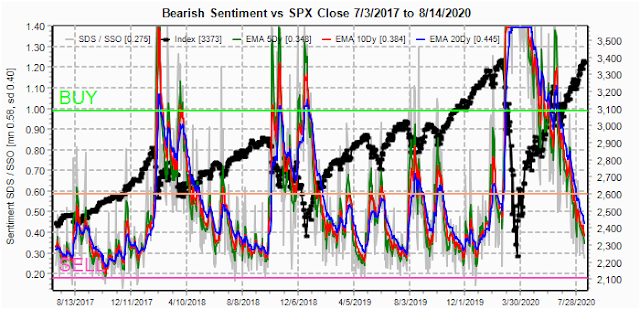
The INT term SPX Long Term (2x/DM) ETFs (outlook two to four weeks) bearish sentiment was off the chart at high bearish levels in Mar 2020, but is now nearing a complete reversal. This indicator does show that an INT top is several weeks away, since previous INT top required the LT EMAs to drop to the 0.30 level (now .4+).
III. Options Open Interest
Using Thur closing OI, remember that further out time frames are more likely to change over time, and that closing prices are more likely to be effected. Delta hedging may occur as reinforcement, negative when put support is broken or positive when call resistance is exceeded. This week I will look out thru Aug 21 and EOM. Since the NDX (QQQ ETF x 41) has been the major source of volatility for the SPX since Mar, I am adding the QQQ this week. Also, this week includes a look at the TLT for Aug exp.
With Fri close at SPX 3373, options OI for Mon shows little directional bias other than strong put support at 3250 and call resistance at 3400. Some pressure to close below 3370.
For EOM 31st, large OI is similar to Aug 21st. If a rally occurs as is indicated by the QQQ for the week of the 24th during the GOP convention, it may be reversed after the convention.
For Fri 28th, QQQ (17th 272.2) large OI shows strong put support at 260, 265 and 270 with almost no call resistance until 280 (NDX 11480) almost 3% above current levels. It's very possible we see a 3% or greater decline next week followed by an even sharper rally the following week to new highs.
Using the GDX as a gold miner proxy closing at 40.35, the OI target of 40 or less from last week seems likely.
Currently the TLT is 163.2 with the TNX at 0.71% and has fallen well below strong call resistance at 170 and is nearing strong put support at 160. Small positive directional bias at this point.
.
IV. Technical / Other
Conclusions. Despite all the claims how the stock markets are "insane" by many of the bearish "seers", market pricing seems perfectly logical when looked at from a sentiment perspective. Bear markets only occur when everyone is bullish. That being said, sometimes it seems like watching paint dry when waiting for a bullish market to turn.
Next week we have the official Bradley major turn date on the 19th as well as the start of the presidential conventions, so there may be a positive start to the week with a downturn likely starting by Tue/Wed. EW and options OI indicate about a 3% drop from current levels to about the SPX 3250-80 area by the EOW. Wall Street's political support may be the true reason for the downturn, and if so, the following week when Trumps followers are cheering will likely bring higher prices, possibly to SPX ATHs 3400-20.
Although the overall and options indicators show an INT top can occur any day, the SPX and NDX 2x ETFs indicate that several more weeks are necessary to achieve a significant top.
Weekly Trade Alert. A possible retest of SPX 3380ish is likely Mon/early Tue with a 100+ pt drop likely by EOW. Updates @mrktsignals.
Investment Diary, Indicator Primer,
update 2020.02.07 Data Mining Indicators,
update 2019.04.27 Stock Buybacks,
update 2018.03.28 Dumb Money/Smart Money Indicators
Article Index 2019 by Topic, completed thru EOY 2020.02.04
Article Index 2018 by Topic
Article Index 2017 by Topic
Article Index 2016 by Topic
Long term forecasts
© 2020 SentimentSignals.blogspot.com


No comments:
Post a Comment