Saturday, March 9, 2019

Betwixt and Between

After calling for a low for the 2018 "bear market" in the SPX the weekend before Xmas at 2350 and the recent ST top last week between 2815-25, I think sentiment has shown its value at identifying tops and bottoms.  Unfortunately, the same can not be said of what happens in the middle as sentiment works best at extremes.  Looking at last weeks action, the SPX dropped midway toward the low mid-2700s target with sentiment moving toward the neutral area.  The tape action was not overly bearish with some of the lightest volume since early Oct 2018, and this may just be an indication of a lack of buying.

The SPX options OI, that has worked well the past three weeks and warned of a downturn last week, is now showing the potential for a consolidation around the 2750 area (2725-75) thru the EOM.  This may simply be a resting place until some news event, Mueller, Brexit or China trade, pushes the SPX 100 pts either way.

I. Sentiment Indicators

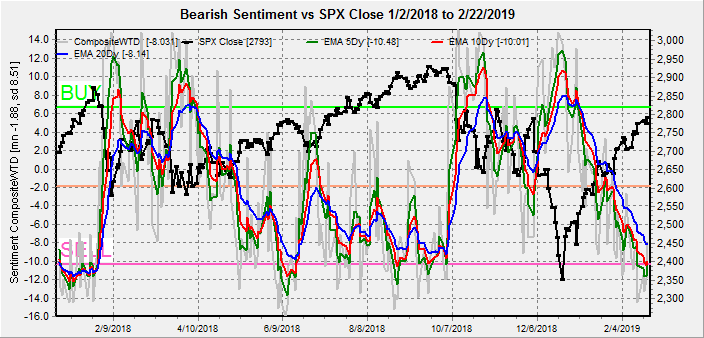
The overall Indicator Scoreboard (INT term, outlook two to four months) bearish sentiment ST EMAs have barely reached neutral.  Too early for a lasting bottom.


The INT view of the Short Term Indicator (VXX+VXXB $ volume and Smart Beta P/C, outlook two to four months) bearish sentiment has barely moved from the SELL level.  Should at least reach the June 2018 price lows level before more than a bounce.


Bond sentiment (TNX) is still looking like the Jun-Sep 2018 period where a three month consolidation was seen before a sharp runup in rates.  Six months ago, I predicted that the Fed funds rate and TNX would meet at 2.5% the 1st half of 2019 as the economy slows.  The prior weeks rise may have been a fake out.


For the INT outlook with LT still negative, the gold miners (HUI) bearish sentiment rose on the early weeks pullback.


ST the HUI has reached the 170 level and may be creating a H&S top.


II. Dumb Money/Smart Money Indicators

The Risk Aversion/Risk Preference Indicator (SPX 2x ETF sentiment/NDX ETF sentiment, outlook 2 to 4 mns/wks) as a INT indicator has improved somewhat with the recent weakness in NDX, but is a long way from a BUY.


The option-based Dumb Money/Smart Money Indicator as short/INT term (outlook 2 to 4 mns/weeks) remains near neutral, but may be a warning as the "smart money" equity p/c is rising persistently, now at 0.75.  Early Dec, I warned that this trend, seen in Sep-Oct 2018, was also seen before the Aug 2015 flash crash with equity p/c at 0.80+.


The sister Hedge Ratio does show rising bearish hedges, but should reach the levels of the Jun 2018 SPX lows before a bottom.


The INT term SPX Long Term/Short Term ETFs (outlook two to four weeks) bearish sentiment remains near neutral as there was a pickup in "dumb money" (2x) selling, while "smart money" (3x) remained neutral.


Long term neutral, the INT term NDX Long Term/Short Term ETF Indicator (outlook two to four weeks) saw a spike lower in sentiment before the selloff with strong "dumb money" buying.  Note the similarity to May 2018 right before a sharp pullback in the NDX.


III. Options Open Interest

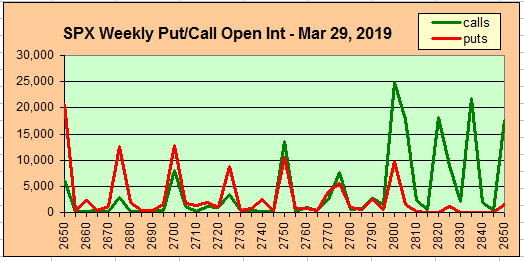
Using Thurs close, remember that further out time frames are more likely to change over time, and that expiration closing prices are more likely to be effected as Friday spent most of the day well below the SPX 2750 support as posted Thur (Twitter) but closed near it.  This week I will look out thru Mar 29 EOM.

With Fri close at SPX 2743, Mon.  Put support could push SPX towards 2770 with call resistance at 2780.  Light open int overall.


Wed shows strong put support at SPX 2750, and prices could fall back to the 2755-60 level.  Not a lot of call resistance to 2825 if the market wants to rally.


Fri, optn exp, AM, positions are mostly hedged. but the 10k unhedged calls should keep prices below SPX 2775 and will likely influence early weeks trading.


PM, similar to the AM where SPX 2775-80 should be firm call resistance with moderate put support at 2725 and 2750.  Most likely close 2760-70.


Wed 20th, FOMC, is the most bullish.  While the current week is likely to trade between SPX 2750-75, FOMC Wed put support should push prices over 2775 with little resistance to 2800.  We could see a reverse of last Fri, where prices push over 2800 Tue/early Wed then reverse into Wed close.  Upside target SPX 2805-15.


Fri 29th, EOM, similar to the current week where there is firm call resistance at SPX 2800 and little net put support until 2675 and 2725.  Prices are likely to range between 2725 and 2775 but could push lower.  Possible Brexit jitters?

IV. Technical / Other

Technical Indicator Composite, NYMO+TRIN+NYAD+NYUD, sentiment has risen from the extreme overbought levels that warned of a V-bottom similar to the Oct-Dec 2014 rally and have now risen to neutral.  This is consistent with Nov-Dec 2014 prior to 38%+ retrace.


2014, sentiment near neutral with double top Nov-Dec.


Conclusions.  Last week, several analysts were warning "beware the Ides of March", but SPX options open int warned that selling could start earlier and the result was a nearly 100 pt drop from the target high of 2815-25.  With "dumb money" preparing for the apocalypse EOW as seen by Fri spike in VIX call buying at the lows, options OI is now warning of a mild consolidation week before another possible test of SPX 2800 the following week and then the apocalypse.  Reminiscent of Oct-Nov 2018s three tests of 2800? 

Weekly Trade Alert.  Current outlook for next week is up-down-up roughly in an SPX 2750-75 range.  More fun is likely later in month with potential for SPX 2800+ (2805-15) FOMC Mar 19-20 then down to test recent lows or lower by EOM.  Will try to update FOMC charts later in week.  Updates @mrktsignals.

Investment Diary,  Indicator Primer,  update 2018.03.28  Dumb Money/Smart Money Indicators
Article Index 2019 by Topic
Article Index 2018 by Topic
Article Index 2017 by Topic
Article Index 2016 by Topic
Long term forecasts

© 2019 SentimentSignals.blogspot.com

Saturday, March 2, 2019

The "New" VIX Call Indicator

As discussed last week, the impulse rally from the Dec 2018 lows was expected to fizzle out once the Indicator Scoreboard and ST Indicators reached their SELL levels, and last week seems to be a similar topping or distribution period as seen from late Nov-early Dec of 2014 in the Oct 2014 V-bottom rally.  If the analog continues to hold, a slightly higher high (SPX 2815-25) is expected before a sharp decline of 5%+ targeting the mid-low SPX 2600s.  This corresponds to a possible volatility event discussed by Nomura's Charles McElligott expected mid-March and supported by the VIX Call Indicator discussed below.

The "old" VIX Call Indicator for several years was one of the most reliable SELL signals for significant market declines with the last official SELL on Jan 10, 2018.  In late Jan and early Feb of 2018, however, as the VIX rose from a low of 9+ to 37, most of the short vol instruments blew up (ie, XIV and probably the VIX call writers accts) and the VIX call volume dried up for many months.  Comparing this to Oct-Dec 2018, the VIX went from 11.6 to 36 over a 3 month period.  Mon, Feb 25th, there was a surge in VIX call volume to about 900k.  So I decided to see if I could come up with a new indicator for the post apocalyptic world.  The results showed a SELL this week (possible 3 week lead time) and are discussed in the Tech/Other section.

One more interesting tidbit this week is, that in spite of all of the dismal economic numbers coming out, interest rates seemed to have bottomed with the TNX up sharply.  What effect will rising rates have on a faltering housing market?  With higher rates and a bottoming US $, gold and gold stocks took it on the chin.  For what is ancient history for many, in the 1970s and 1980s, the Fed used to fear the bond vigilantes and would have to raise short term rates to keep long term rates from rising too high.  It's possible that the slowing economy is actually putting upward pressure on rates since this means lower tax receipts to pay for the higher deficit spending.  Powell's put maybe in jeopardy.

I. Sentiment Indicators

The overall Indicator Scoreboard (INT term, outlook two to four months) bearish sentiment appears to be bottoming at the SELL level.


The INT view of the Short Term Indicator (VXX+VXXB $ volume and Smart Beta P/C, outlook two to four months) bearish sentiment continues to decline a may be a warning of high volatility ahead (VXXB).


Bond sentiment (TNX) is still looking like the Jun-Sep 2018 period where a three month consolidation was seen but may be in the early stages of an up move.  Since the 2017 move was from 2.1% to 3.2%, this move may be from 2.6% to 3.7% or higher.  Given the stock market rise for Jan-Feb was the strongest since 1987, it would be interesting to see what happens if the TNX rate rises to 2X the DJIA div yield, currently 2%, as also happened in 1987.  We may see a consolidation at 2.8%, but a continued rise into the FOMC Mar 19-20 may pressure the FED to be more hawkish.


For the INT outlook with LT still negative, the gold miners (HUI) low bearish sentiment with rising rates and a stronger US $ may too much for gold/miners.  From the 2017 highs the HUI fell 80 pts from 220 to 140, could we see a similar decline to 100 from 180?


For the ST outlook for the gold miners, bearish sentiment may have reached a pt where a pause or H&S pattern could appear.


II. Dumb Money/Smart Money Indicators

The Risk Aversion/Risk Preference Indicator (SPX 2x ETF sentiment/NDX ETF sentiment, outlook 2 to 4 mns/wks) as a INT indicator continues to show dangerous risk seeking behavior.


The option-based Dumb Money/Smart Money Indicator as short/INT term (outlook 2 to 4 mns/weeks) rose to a weak BUY last week which is why I warned Fri (Twitter) of a possible retest of recent highs.  This is exactly what happened in 2014 after an initial 1%+ pullback.


Comparing the option-based Dumb Money/Smart Money Indicator to 2014, the weak BUY shown last week only saw a few days of reprieve before a strong downdraft produced a stronger BUY.


The INT term SPX Long Term/Short Term ETFs (outlook two to four weeks) bearish sentiment is mostly unchanged with "smart" money neutral and "dumb" money buying.


Long term neutral, the INT term NDX Long Term/Short Term ETF Indicator (outlook two to four weeks) no longer seems to be following prices and may be following the 2014 analog where the SPX DM/SM Indicator failed but the NDX indicator worked.


Comparing to 2014, the INT term NDX Long Term/Short Term ETF Indicator sentiment in Feb 2019 is very similar to the Nov 2014 highs.


III. Options Open Interest

Using Thurs close, remember that further out time frames are more likely to change over time, and more puts now seem to be added one/two days before expiration.  This week I will look out thru Mar 15.

With Fri close at SPX 2804, Mon seems to indicate a pullback to at least 2790, but there is very little resistance above 2800 if prices hold 2800.  Light open int overall.


Wed is similar with the SPX over 2800, where resistance begins at 2825, below 2800 there is some support at 2790.  Very light open int overall.


Fri, jobs report, holding SPX 2800 here is critical, as there is almost no net put support down to SPX 2675.  Possibly a strong jobs report could rattle the bond market that already seems to be falling apart, or some other news (Mueller report) could shake the stock market.  Large open int.


For the 15th, optn exp, AM & PM show about the same thing where support is up to SPX 2750 and resistance is above 2750 with a likely close around 2750.  With PM more positive.


IV. Technical / Other

In order to compensate for the "new regime" for the "old" VIX Call Indicator after Feb of 2018, I decided to start a new data series beginning in Mar 1, 2018.  A complete data series should include at least one bull/bear cycle and with the rally from the 2018 Apr lows to Oct highs then to the Dec lows, we got a complete cycle.  Results are shown below.  Remember for the dual axis the "0" line is the 20 day SMA for the SPX and the 10 day VIX SMA / avg number of VIX calls, while 1 unit on the Y-axis is 6% above/below the SMA for the SPX and 100% of the VIX calls above/below the avg.  A rise of 50% of the avg for the 10 day VIX SMA is a SELL if the SPX is above the 20 day SMA and a BUY if below.  Three weeks is considered the avg lead time.

Four SELLs have been generated since Mar 1,2018.  In 2018, Mar 7-21 saw the indicator rise 50% low-high and by Apr 6 the SPX had fallen 150 pts in 2.5 wks, from Apr 4-17 the indicator rose 50% low-high and by May 3 the SPX had fallen 100 pts in 2.5 wks, from Aug 1-21  the indicator rose 72% low-high and the Sept 21 high at SPX 2940 occurred a month later.  Lastly Feb 1-26, 2019 saw the indicator rise 50%.  Three weeks from Feb 26 is Mar 19, which happens to be the monthly opt exp for the VIX options.


For the VIX options, most of the VIX options are between 20-25, so assuming this represents "smart" money a rise in the VIX to 24-5 is likely.


Conclusions.  Evidence continues to mount of an approaching "moderate" seismic event first with the sentiment indicators and the Oct-Dec 2014 analog, and now the "beware the Ides of March" of Nomura's C. McElligott and the VIX Call Indicator.  The timing is somewhat uncertain, but likely sometime the next three weeks.  A slightly higher SPX level is likely first in the 2815-25 area.  Options OI indicates the top may be in as early as next Wed.

Weekly Trade Alert.  A slightly higher high (SPX 2015-25) is expected before a sharp decline of 5%+ targeting the mid-low SPX 2600s.  In Dec 2014, the SPX retraced 42% of the V-bottom rally from the mid Oct lows in seven trading days.  A similar decline could start any time over the next three weeks, but is likely to be BTFD for a rally back to the SPX 2840-50 and DJIA 26.5K areas.  Updates @mrktsignals.

Investment Diary,  Indicator Primer,  update 2018.03.28  Dumb Money/Smart Money Indicators
Article Index 2019 by Topic
Article Index 2018 by Topic
Article Index 2017 by Topic
Article Index 2016 by Topic
Long term forecasts

© 2019 SentimentSignals.blogspot.com

Saturday, February 23, 2019

Nearing a Short Term Top

So far my long term outlook from Dec 28th appears to be correct in that the Oct-Dec 2018 decline was not the start of a bear market, but simply a panic decline of nearly 20% similar to the 1998 LTCM crisis.  My preference is still that there will be lower lows. however, and that the current rally is simply a large B-wave correction of a larger decline.  So far the V-bottom has followed the Oct-Dec 2014 analog where a large impulsive wave would target SPX 2725-2825 or 80-90% of the full rally.  In 2014, the end of the impulsive wave was identified by reaching SELL levels in the sentiment Indicator Scoreboard and Short Term Indicator.

The past few days have brought the SPX very close to those levels.  The question remains as to how the top will form.  My preference is a pullback to the low 2700s next week, followed by a second top around the March optn exp on the 15th, then a second decline to the mid-2600s.  Important news events are the Mueller results that may come out the next couple of weeks, the jobs report March 8th, and the FOMC March 19-20.

I. Sentiment Indicators

The overall Indicator Scoreboard (INT term, outlook two to four months) bearish sentiment dropped sharply last week reaching the SELL level for all but the longest EMA.


Comparing this to the 2014 analog, we have now reached the level close to the first double top in late Nov 2014.


The INT view of the Short Term Indicator (VXX+VXXB $ volume and Smart Beta P/C, outlook two to four months) bearish sentiment has also declined to SELL levels comparable to other significant tops in 2018.


Bond sentiment (TNX) is still looking like the Jun-Sep 2018 period where a three month consolidation was seen before a sharp runup in rates.


For the INT outlook with LT still negative, the gold miners (HUI) bearish sentiment has remained at low levels, but as seen in the past has not stopped rallies supported by a weaker US$ and low TNX rates.


And for the ST view,  bearish sentiment remains above the SELL level so it is hard to say if a top is in.


II. Dumb Money/Smart Money Indicators

The Risk Aversion/Risk Preference Indicator (SPX 2x ETF sentiment/NDX ETF sentiment, outlook 2 to 4 mns/wks) as a INT indicator still shows strong risk preference that may limit advances and could be following a pattern from Oct-Nov 2018.


The option-based Dumb Money/Smart Money Indicator as short/INT term (outlook 2 to 4 mns/weeks) has been declining gradually that may indicate a longer topping period.


And comparing to the 2014 analog, we are still missing the sharp declines in sentiment seen before the Dec 2014 top.


While its sister sentiment indicator the Hedge Ratio, does show the sharper declines in sentiment that would be consistent with a somewhat more violent double top than what was seen in 2014.


The INT term SPX Long Term/Short Term ETFs (outlook two to four weeks) bearish sentiment still remains very low resulting from continued buying by dumb money (2x) while smart money (3x) remains neutral.


Long term neutral, the INT term NDX Long Term/Short Term ETF Indicator (outlook two to four weeks) as the long cycle seems to follow prices, the short cycle has remained at very low levels.


III. Options Open Interest

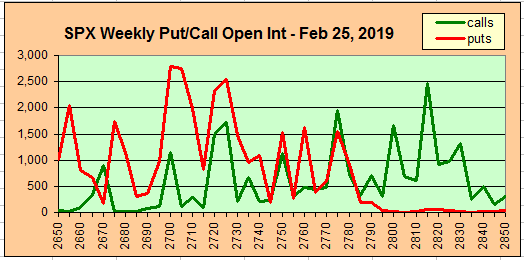
Using Thurs close, remember that further out time frames are more likely to change over time, more recently as shown with last weeks daily updates, more puts seem to be added one/two days before expiration.  This week I will look out thru Mar 1.

With Fri close at SPX 2793, Mon looks like the most bullish day of the week with put support up to 2775 and call resistance ar 2800 and stronger at 2815.  A push to 2810 could be reversed to below 2800 by the end of day.  Light open int overall.


Wed has strong put support at SPX 2750 and 2710, and if SPX remains below 2800 call resistance could push prices to 2775 or lower.


For Thur EOM with very large open int, the overlaps at SPX 2725, 2750 and 2775 may allow prices to swing either up to 2800 or down to 2700 or below.  Updates may clarify.


Fri currently has a very bearish outlook where call resistance is greater than put support above SPX 2700.  The Mueller report was supposed to come out this week, but has been delayed, so I don't expect anything much below 2725.


IV. Technical Other

Comparing $SKEW to 2014, a similar rise occurred Dec-Feb 2018 as Oct-Sec 2014. note that the retest in SPX Aug 2015 did not occur until several months after the $SKEW retested its previous lows.


Conclusions.  Sentiment is now at or near levels that indicate most of the rally off the Dec lows is over, but as was seen after the Oct 2014 and Aug 2015 lows several months of distribution are likely before a retest.  The $SKEW compared to 2014 shows that a retest of the EMAs below 120 will probably proceed a retest.  Options OI show that a high could occur early next week between SPX 2800-2815 and then decline sharply thru the end of week.  Possibly, with the China trade deadline scheduled for Mar 1, lack of concrete agreements may lead to a set back in stock prices.

Weekly Trade Alert.  Heads up for some potential volatility with a Mon/Tue high above SPX 2800 followed by a decline toward the 2720s.  Updates @mrktsignals.

Investment Diary,  Indicator Primer,  update 2018.03.28  Dumb Money/Smart Money Indicators
Article Index 2019 by Topic
Article Index 2018 by Topic
Article Index 2017 by Topic
Article Index 2016 by Topic
Long term forecasts

© 2019 SentimentSignals.blogspot.com