Sunday, January 29, 2017
Nearing the Edge of the Cliff
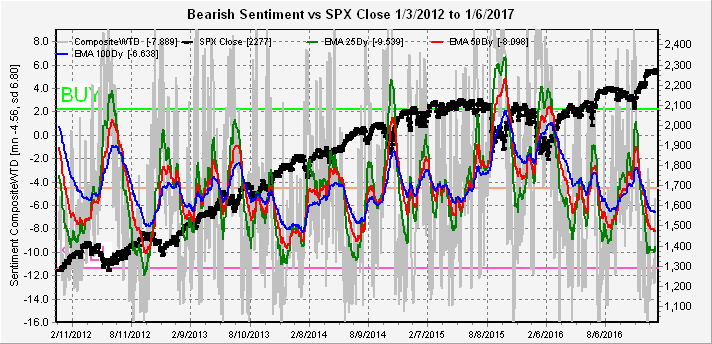
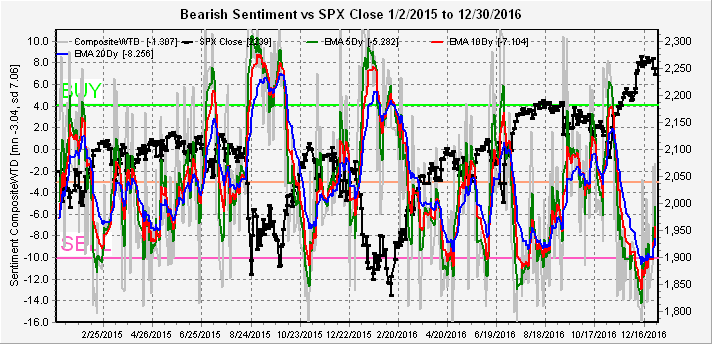
For stocks (SPX), the story is much the same with low bearish sentiment remaining and no apparent reason for things not to continue so. My reasoning remains that higher rates will be the key to bring down the house of cards for a broad range of asset classes.
Now looking at the indicators, the overall Indicator Scoreboard has now fallen back to the SELL level, indicating that at least a short term pullback is likely to start next week, but does not rule out a continuation top similar to the first half of 2015 or mid 2016.
The Short Term Indicator (VXX $ volume and Smart Beta P/C) has also turned lower but has still failed to reach the extremes seen before the Aug 2015 and Jan 2016 for the very short term.
If I seem to be somewhat more conservatively bearish, I will show two of the MISC indicators that do not seem to be indicating a short term top yet. The first is the TRIN (essentially a measure of net adv issues to net volume) which usually shows lower supporting volume or higher ratios as seen in Aug 2015 or late 2016.
The second indicator is the VIX P/C, where lower levels are typically seen before a significant selloff.
Moving on to bonds (TNX), investors seem to be flocking into the bond ETFs as rates have stabilized around 2.5%. Interest rates have been somewhat weaker than I expected to date, but a breakout to the upside still seems more likely.
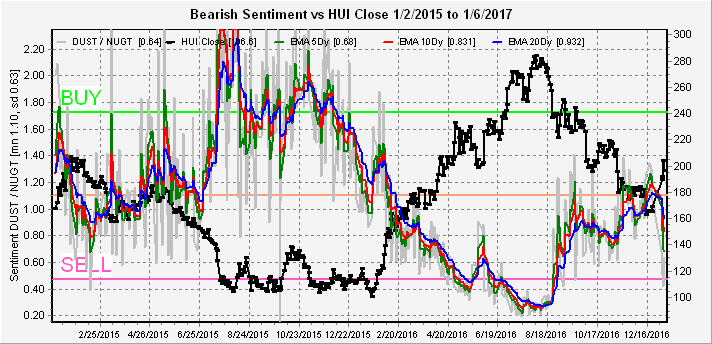
Finally, the gold stocks (HUI) shows an even sharper drop in bearish sentiment even as the HUI has stalled out around the 200 level. Compared to bonds gold stocks seem to be betting on higher growth and more inflation, while bonds seem to be expecting lower growth and less inflation.
Conclusion. The end of January has produced a positive result as expected, but some of the indicators are not as extreme as expected for a major top. I will be watching bonds (TNX) very closely as a breakout over the 2.6% level may be required for a major selloff to start.
Weekly Trade Alert. I did call off all trades last week via @mrktsignals due to pre-market levels and EOM timing considerations. This week there are no clear shorting levels, so I will probably stand pat with any changes posted on Twitter.
Sunday, January 22, 2017
Game Time
Looking at the overall Indicator Scoreboard, bearishness remains at low levels after reaching a momentum extreme low. An advance toward the mean is not unlikely before a correction begins.
The Short Term Indicator (VXX $ volume and Smart Beta P/C) is in a similar position.
Looking at the SPX 3x ETFs SPXU/UPRO shows that bearishness is becoming more compressed to the SELL side, leaving little hope for those expecting a breakout rally at this time.
The strongest index, the NDX, show bearish sentiment about as low as it can get using the 3x ETFs.
Sentiment for bonds (TNX) using TBT/TLT showed a surprising drop in bearish sentiment even as rates rallied back to the 2.5% level. Not what you want to see if you are a bond bull.
The gold miners (HUI) continue to bet on the reflation trade at the same time as the HUI stalls out at the same level as the early 2015 rally top. Sentiment for bonds and gold indicate the advance in rates with continued pressure on gold is just ahead.
Conclusion. Not much change from last week. All signs are pointing to tops in January for a variety of assets, as I continue to believe that higher rates are the biggest concern going forward for most of 2017.
Weekly Trade Alert. We did not get the expected move last week for the SPX to 2285-90. So I am moving my timing top to the EOM. Short at 2285-90 with a stop at 2300. Updates will be posted @mrktsignals if a trade is recommended or any change in outlook is necessary.
Sunday, January 15, 2017
Bull Market or Just Bull
The overall Indicator Scoreboard saw a very small uptick in bearish sentiment, but no change in overall posture.
The Short Term Indicator (VXX $ volume and Smart Beta P/C) is in a similar trending up, but bearish position.
Price and sentiment are relatively unchanged for bonds (TNX).
Sentiment for the gold miners (HUI) has dropped to an almost bearish low extreme although still a similar pattern to the early 2015 period.
Conclusion. Although I still think we may have the "reflation rally" that everyone has been looking for the last three years, economic patterns show a clear lag between policy inception and effectiveness. Typically a 6 to 12 month period is necessary to develop policy then another 12 to 18 months to see the full effect. This means a low could be see by mid 2018 and a high by 2020. If you think the stock market sees all, just remember the housing crisis.
Weekly Trade Alert. A significant top is likely soon. Look for the SPX to pop to 2285-90 next week with a short at 2285 and a stop at 2300. Updates will be posted @mrktsignals if a trade is recommended or any change in outlook is necessary.
Sunday, January 8, 2017
Twenty Thousand Leagues Under the Sea
Sunday, January 1, 2017
Ringing in the New Year
Next I want to outline what I see as the ideal scenario for the first quarter. Sentiment has a major influence on the markets direction, and is often a result of false signals from market actions. For instance, last January was one of the worst in many years, and based on the so called "January effect", many concluded a new bear market was beginning. Instead, the market rallied 25% from the lows by December. As I have pointed out earlier, sentiment is now indicating a down year for 2017, but I am expecting a positive January effect to again give a false signal. This would require an up market the first week and at month end. So after a positive start, a decline of 3-5% by mid-month to about SPX 2200, then a month end rally that may have one or more indexes at ATH high would be ideal.
The biggest potential problem for the first quarter will be strong job reports (~200K) and other economic reports that may cause the Fed to raise rates again in March. The Initial Claims that usually moves inversely with jobs is hovering at the lowest level in 35 years, indicating potential for wage inflation. If true, Feb and March will likely see a rise in bond interest rates and the SPX dropping down to retrace the post-election rally (2080) by the end of March.
Moving on to the sentiment indicators, a nice drop of about SPX 40 points followed the Short Term Indicator (VXX $ volume and Smart Beta P/C) SELL. As a result there was a small rise in bearish sentiment, but not enough to indicate a change in direction.
The overall Indicator Scoreboard has only seen a small rise in bearish sentiment.
Bonds and gold both had a brief but strong rally last week probably due relief of tax loss selling with bond (TNX) sentiment moving back to neutral. The gold stocks (HUI) outlook seems more ominous with short term sentiment dropping well below the mean in a pattern similar to Apr to May 2015.
The NDX remains the most bearish of the indices with sentiment hovering near the lows.
Finally, the banking index BKX with FAZ/FAS has seen a very sharp drop in bearish sentiment as the BKX has rallied 50% in the last 6 months. However, given the long period of accumulation (BUY zone), the index is in a similar position as the HUI in May of 2016 where the initial drop to the SELL zone was meet by a lengthy period of distribution similar to the BKX from March thru July.
Conclusion. Sentiment wise, of all the indices the BKX is probably the least bad and is likely to outperform over the next few months, while the NDX and HIU are the worst. It's hard to say at this time whether the market continues downward as sentiment indicates or presents the "false signal" I outlined above. These two to four week selloffs, followed by 4 to six month rallies are starting to remind me of a 2014 Sci-Fi movie, Edge of Tomorrow with Tom Cruise, where time looped back every time he died.
Weekly Trade Alert. I hope some you were able to short at SPX last week as my entry was meet, but I was too hesitant on the Monday ramp. My New Year's resolution is to work on my trading skills. Same as last week if strong start to year, short on the SPX on a retest of the highs next week 2270-75 with a stop at 2290. Updates @mrktsignals if necessary.
Saturday, December 31, 2016
Article Index 2016
2015.03.. Long term forecast. Are high stock prices reasonable in a low growth economy?
2015.11 #1 First use of composites to combine indicators as standardized variables.
2015.11 #2 Sell signal generated with composite at -1 SD, expecting 10+% decline in SPX.
2015.11 #3 Closer look at the VXX $ volume indicates max risk in Dec-Jan.
2015.11 #4 Possible rally into Thanksgiving, revising the CPC for VIX component.
2015.11 #5 Using short/long ETFs to develop synthetic put/call ratios.
2015.11 #6 Use of short/long ETFs for HUI indicate 50-60% rally likely for gold stocks.
2015.12 #1 A look at composites and several ETF indicators.
2016.01 #1 Sentiment update.
2016.01 #2 Bearishh sentiment rising, a look at TBT/TLT for bond sentiment.
2016.01 #3 Bearishh sentiment nearing extreme but could go higher, ETFs for RUT and NDX,.
2016.01 #4 Use of sentiment models in bear markets, what to look for after Mar-Apr rally.
2016.02 #1 Rising bearishness and a spike in VIX P/C indicate washout ahead followed by sizable rally.
2016.02 #2 Some indicators showing strong buy while others are neutral.
2016.02 #3 Drop in bearish sentiment for HUI but too early to be negative. Students Trifecta composite.
2016.03 #1 Using Students Trifecta more rally likely but expecting summer pullback.
2016.03 #2 First attempt at Indicator Scoreboard.
2016.03 #3 Students Trifecta composite indicates a short term top is near.
2016.03 #4 Extremes of some individual indicators may support continued strength.
2016.04 #1 Indicators pointing to a pullback, but not a final top. Bonds and gold trending sideways.
2016.04 #2 Too early to be short, a look at intermediate and long term volatility measures.
2016.04 #3 A look at composites and ETFs, no immediate sell signals.
2016.04 #4 Using stastical correlations with indicators and expected returns (back tested).
2016.05 #1 Setting up an overall Indicator Scoreboard using correlations as weightings.
2016.05 #2 Expecting a short term rally then lower lows.
2016.05 #3 Nearing a bottom.
2016.05 #4 Setting up for a rally.
2016.05 #5 Topping pattern may extend four or five months.
2016.06 #1 Rangebound markets, backtesting Indicator Scoreboard for 2013-14.
2016.06 #2 Looking for expansion of trading range, strong bounce after panic low below SPX 2085.
2016.06 #3 Strong rally likely after BREXIT vote due to volatility blowout.
2016.06 #4 Sentiment unclear as strong rally lowers bearishness.
2016.07 #1 Positive bias for now with higher risk for August.
2016.07 #2 Unclear for SPX, but HUI low bearish extremes pointing to significant top.
2016.07 #3 Some but not all indicators at low extremes, expecting top by EOY. Use of Short Term Indicator.
2016.07 #4 Review of various composites.
2016.07 #5 Short term top is likely.
2016.08 #1 Low bearish sentiment continues, but risk of significant decline unlikely until after election.
2016.08 #2 Similarities to first half of 2015, but short term volatility may increase.
2016.08 #3 Still locked in tight range.
2016.08 #4 Looking for brief decline before move to SPX 2200.
2016.09 #1 More consolidation.
2016.09 #2 Sharp decline before BREXIT, indicators neutral.
2016.09 #3 Spike in bearishness for SPX likely point to new ATH, recent complaceny in HUI means lower lows.
2016.09 #4 Topping process continues.
2016.10 #1 Short term indicator has a long way to go before a SELL.
2016.10 #2 Sentiment points to higher interest rates, lower gold stocks, but neutral for SPX.
2016.10 #3 Possible short term dip but double buy spike in ST Indicator points to strong rally.
2016.10 #4 Expecting strength before election, sharp decline then rally.
2016.10 #5 Concerns over Hillarys emails may push SPX down to 2100 before election.
2016.11 #1 Spike in bearish sentiment likely to lead to fast and furious rally post-election, still negative on gold.
2016.11 #2 Long term indicators pointing to 15-20% correction over next 12 months, but no immediate decline. Gold and bonds following sentiment patterns.
2016.11 #3 Am I the only bear? Indicator Scoreboard same as EOY 2015, but ST Indicator neutral.
2016.11 #4 Bearish sentiment continues to fall but no official SELL. Bond sentiment spikes, HUI sideways.
2016.12 #1 With sentiment so low Santa Claus rally may be over early this year.
2016.12 #2 Overall Indicator Scoreboard reaches SELL level, but STI still supportive of higher prices.
2016.12 #3 Fed rate hike crashes gold and sends rates soaring, but sentiment only yawns.
2016.12 #4 Short Term Indicator now at a SELL. A LT look at the BKX using FAZ/FAS etfs.
2016.12.. Long term forecast. What Happens When Growth Returns?
Sunday, December 25, 2016
Alarm Bells are Starting to Go Off
The overall Sentiment Scoreboard for the SPX remains pinned to the SELL zone and has now done a 180 degree turn from the January market lows. I am now starting to wonder if I am bearish enough.
The Short Term Indicator (VXX $ volume and Smart Beta P/C) has now reached the minimum for a confirmed SELL with the 5 Dy EMA at -0.4 and the 20 Dy EMA at -0.25.
Looking more closely at the Short Term components, the VXX $ volume (adj for market volume) has the long term EMAs at the lowest level for the last two years, warning of a pickup in volatility.
The second component, the Smart Beta P/C (ETF Puts/Equity Calls), is lagging the VIX $ Vol, but the overall pattern since June resembles the first half of 2015 which also showed the same divergence in August 2015.
The money flow indicator SPXU/UPRO has now reached a new low extreme after a brief bounce continuing to trace out the same pattern as the first half of 2015 only now for about 50% longer in duration.
Looking at some of the other indices, the NDX shows similar results as the SPXU/UPRO.
The RUT has seen a sharp drop in bearishness even as the rally has run out of stream, not a good sign.
The gold miners HUI has finally seen some increase in bearishness as the index fell below the critical 180 area last week, but the long term EMA (blue) has only now reached the neutral area and is in the same position as June of 2015 when the index continued to fall to 100.
Bond sentiment (TNX) is hovering around the same area as in April of 2015 when interest rates were only 1.9%, so the overall outlook for bonds remains bearish.
Lastly, I just completed replacing the biotech index IBB with the banking index BKX using the FAZ/FAS ETFs. This is a long term look and next week I will show the normal period. As you can see a strong BUY was issued mid-year so the resulting rally is no surprise. The only question is how high can it go.
Conclusion. We are now seeing the lowest levels of bearishness of the last two years. In addition to the above, VIX call buying spiked higher on Wed and Thur roughly equal to Dec 14 & 15 of 2015, this was about a week and a half before the decline started.
Weekly Trade Alert. My overall preference is for an extension top into the first of the year, but sentiment is so extreme that I will consider a half position short on the SPX on a retest of the highs next week 2270-75 with a stop at 2290. Updates @mrktsignals if necessary.