Last week, I was looking for a top in the SPX around 2400, near the Friday close, but on Twitter warned to wait for a "pump and dump" after the French election. At SPX 2380 early in the week, I thought we might each 2405, but after the Wed debate favoring Macron moved the SPX to 2390, 2410 seemed more likely, and finally the Friday close near 2400 has me looking for 2415. I've noticed in the past that moves in Europe result in about half the percentage change for the US markets, so SPX 2415 may result from a 1.5 to 2.0% change in Europe. Obviously, the move late in the week has reflected part of the change.
Moving on to sentiment the biggest change was Monday's 13% drop in the SKEW from 147 to 128, which lowered the expectations for large price moves as we saw in the weekly range of 2379-2399. So the expected drop of 3-4% may take from mid-May to mid-June.
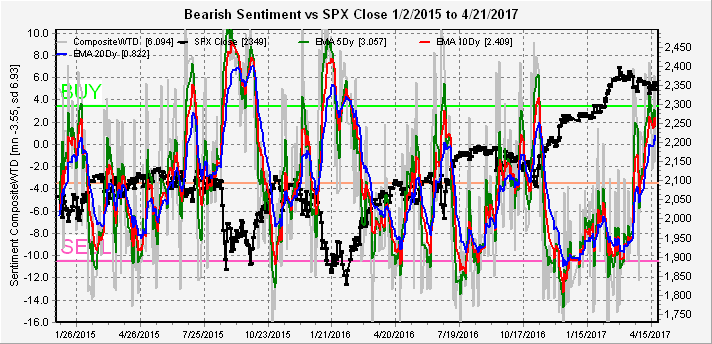
Looking next at the SPX sentiment indicators from Jan 2015, the Indicator Scoreboard since last Oct has repeated the sentiment pattern from Jan to July and Nov-Dec 2015, but the TRIN is not as excessive and the recent drop in the SKEW points to less volatile declines than from the 2015 tops.
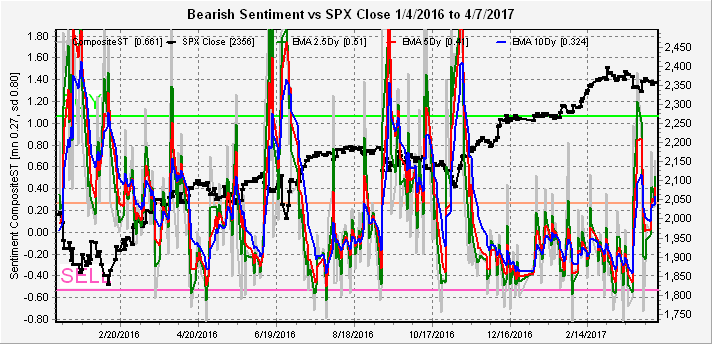
The Short Term Indicator (VXX $ volume and Smart Beta P/C) with intermediate EMAs has now fully reached the SELL level, last seen in Nov 2015. This plus the Indicator Scoreboard reading indicate that an initial 3-4% decline may not be sufficient for a strong bottom.
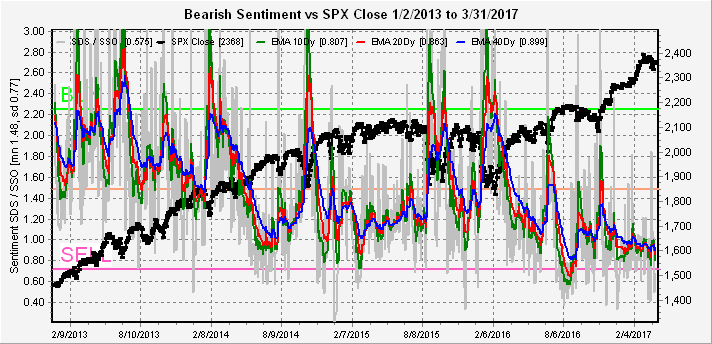
The additional chart for the SDS/SSO ETFs seems to support this idea with low bearish sentiment since July 2015.
Sentiment for bonds (TNX) has stabilized near the mean so rates may stabilize until mid-June if the SPX corrects.
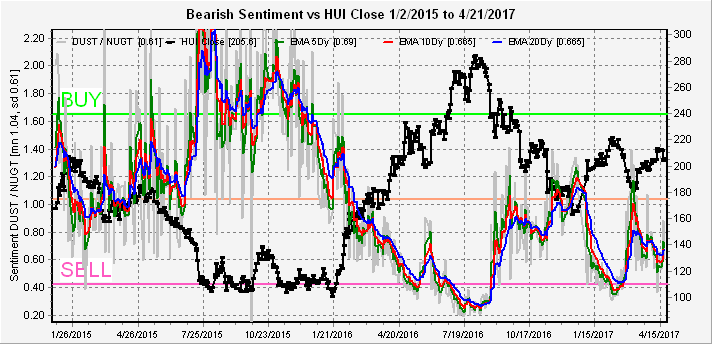
Gold stock sentiment (HUI) remains low even after the HUI testing the recent lows, so it's unclear whether the HUI can bounce to the 200 SMA (200-205) if stocks correct, then crash, or whether it just continues downward.
Conclusion. Stocks (SPX) are likely to move lower after making an ATH next week and may be making a final top depending on how sentiment looks after a decline. If the SKEW remains low and the decline is gradual, we may only get a big yawn from the bears and stocks may find themselves in a situation similar to the HUI.
Weekly Trade Alert. Ideally, I will be looking for a SHORT at SPX 2415 (range 2410-2420) based on Europe's reaction to the French election. Target is SPX 2320-2330, Stop 2430. Based on Friday's symbolic levels (DJIA 21K, SPX 2400) the top may carry over into Wed-Thur. Updates @mrktsignals.
Article Index 2017 by Topic
Article Index 2016 by Topic
© 2017 SentimentSignals.blogspot.com
Saturday, May 6, 2017
Article Index, 2017 by Topic
2016.12 Long term forecast. What Happens When Growth Returns?
2017.01 #1 Expecting strong start to year, weakness later with higher s/t rates. Start BKX FAS/FAZ.
2017.01 #2 Indicator Scoreboard at SELL as DJIA crosses 20K. S/T Indicator holds above SELL.
2017.01 #3 Not expecting reflation rally until mid-2018. HUI nears SELL.
2017.01 #4 SPX and NDX ETFs bearish sentiment at lowest level in several years.
2017.01 #5 Looking at TRIN and VIX P/C do not see signs of significant top yet.
2017.02 #1 SPX topping pricess may continue. Gold stocks and bonds nearing SELL.
2017.02 #2 SPX may top out at 2390. Gold stocks on SELL HUI at 220.
2017.02 #3 L/T Indicator Scoreboard very bearish, but S/T Indicator refusing to show SELL.
2017.02 #4 Trump reforms delayed. VIX P/C and TRIN moving to bearish.
2017.03 #1 SPX bubble continues. HUI crushed as rates rise.
2017.03 #2 Market pressure may appear by mid-May. Bonds and HUI may bottom S/T.
2017.03 #3 Using the SKEW as indicator of large price moves, up and down,
2017.03 #4 Buy on S/T Composite & high SKEW indicate large move up for SPX likely.
2017.04 #1 EOQ windiw dressing starts rally, but sharp drop in bearishness.
2017.04 #2 Overall long term view of ETFs contradict consensus growth/inflation views.
2017.04 #3 BUY for Indicator Scoreboard and high TRIN point to final rally. Inverse HUI and TNX moves continue.
2017.04 #4 Using VIX P/C and TRIN composite shows high risk of >= 3% decline in SPX.
2017.04 #5 Nearing a SELL on SPX, possible SPX 2400+ at FOMC for top.
2017.05 #1 Possible top after French election, but lower SKEW indicates slow drop.
2017.05 #2 Very low VXX $ volume warns of probable drop SPX 2320-50 w/retest ATH by EOM June.
2017.05 #3 Mid-week drop to SPX 2350 gives ST Buy, expect 2400+. Intro to Options open interest.
2017.05 #4 SPX may remain over 2400 for a while, 7-8% pullback likely Jul-Sep. GDX options indicate 22-4 range.
2017.06 #1 SPX no signs of Sell, bonds near Sell, HUI neutral. Options show SPY 243-4 possible.
2017.06 #2 SPX overall indicator at Sell, but not smart beta p/c. Possible July top. Sell on TNX at 2.2%. Options GDX 22-4.
2017.06 #3 SPX bearish sentiment rising to neutral w/tech volatility. Options for July show resist at SPY 247. Similarities to 2014 for SPX.
2017.06 #4 SPX sentiment below neutral but NDX at Buy. Options - July 21 best prob of move to SPY 247, Sept 15 poss drop to 235. 3 volume indicators - high risk, capitulation, buy/hold/crash.
2017.07 #1 Rise in bearish sentiment may support SPX 50-75 pt rally from 2405, NDX sentiment extreme. Options using VIX monthly shows poss sharp vol rise into Sept 15.
2017.07 #2 SPX flat for week but volatility increased sentiment over neutral. Option open int show modest SPX strength to mid-Aug, QQQ strong support.
2017.07 #3 Strong rally lowers SPX sentiment, NDX sentiment points to new highs.
2017.07 #4 Overall sentiment pts to nearing top. NDX possible to 6000. VIX call indicator. Options int - down mid-Aug-Sep, up to mid-Oct.
2017.08 #1 Nearing major top. TA pts to SPX 2485-95 int top (act 2491), int target 2400, st SPY < 246.
2017.08 #2 Rapidily rising bearish sentiment likely to prevent drop to 2400. Rally to SPX 2480 possible. SPY target 246/7. VIX call indicator BUY.
2017.08 #3 Looking for SPX low 2405-15 (act 2417), possible rally into Labor Day to test ATH. HUI sentiment improving.
2017.08 #4 Bearish sentiment now at very high levels for SPX, HUI sentiment more positive.
2017.09 #1 Bounce as predicted, very high ST Indicator likely to result in 2-3 mn range 2450-2500.
2017.09 #2 Overall sentiment neutral, but high STI means more gains likely.
2017.09 #3 LT indicators show major top ahead, STI pts to SPX 2540-50 mid-Oct, Qtrly OI shows pullpack Nov-Dec low SPX 2400s.
2017.09 #4 Money flow (ETF) indicators pt to LT top ahead across asset classes. VIX call ind rising but no sell.
2017.09 #5 No change for most sentiment, but felling déjà vu to late 2015. VIX calls give SELL, may tie to NK holidays Oct 10/18.
2017.10 #1 VIX call indicator showing a sell, but ST Indiator only at neutral.
2017.10 #2 ST Indicator nowhere near a sell. Comparison to 2015 may indicate top early Nov near SPX 2600.
2017.10 #3 Upside targets reached, but persistent bearishness supports higher prices.
2017.10 #4 Possible small pullback then rally to SPX 2600, larger pullback by options exp.
2017.11 #1 Some sentiment measures show top may be near, but high VXX $ volume show top may be farther away than expected.
2017.11 #2 Expecting choppy week then move to SPX 2600+ early Dec, low SKEW means low risk of large decline. Bonds show rising bearishness that may be smart money.
2017.11 #3 Prior weeks choppiness has pushed up bearishness to level consistent with SPX 2600+ by early Dec.
2017.11 #4 More upside is likely before a pullback into mid-Dec.
2017.12 #1 Recent spike in VXX $ vol shows bears too eager, with very low revised CPC pt to a few more weeks of rally to SPX 2700+ into Jan, then 5-7% correction.
2017.12 #2 ST Indicator still positive with strong NDX upside sentiment, bonds pointing to upside breakout w/TNX 2.7-8% problem for stocks.
2017.12 #3 Consensus of SPX 3000 by EOY pts to meltup/meltdown or failure. Bond sentiment pts to higher rates.
2017.12 #4 No Santa rally points to Jan upside surprise. Early Jan over SPX 2700 w/ possible pullback to mid month.
2017.12 #5 Overall Indicator signals INT top near, ST Indicator says not yet. Mixed signals with weak close.
2017.01 #1 Expecting strong start to year, weakness later with higher s/t rates. Start BKX FAS/FAZ.
2017.01 #2 Indicator Scoreboard at SELL as DJIA crosses 20K. S/T Indicator holds above SELL.
2017.01 #3 Not expecting reflation rally until mid-2018. HUI nears SELL.
2017.01 #4 SPX and NDX ETFs bearish sentiment at lowest level in several years.
2017.01 #5 Looking at TRIN and VIX P/C do not see signs of significant top yet.
2017.02 #1 SPX topping pricess may continue. Gold stocks and bonds nearing SELL.
2017.02 #2 SPX may top out at 2390. Gold stocks on SELL HUI at 220.
2017.02 #3 L/T Indicator Scoreboard very bearish, but S/T Indicator refusing to show SELL.
2017.02 #4 Trump reforms delayed. VIX P/C and TRIN moving to bearish.
2017.03 #1 SPX bubble continues. HUI crushed as rates rise.
2017.03 #2 Market pressure may appear by mid-May. Bonds and HUI may bottom S/T.
2017.03 #3 Using the SKEW as indicator of large price moves, up and down,
2017.03 #4 Buy on S/T Composite & high SKEW indicate large move up for SPX likely.
2017.04 #1 EOQ windiw dressing starts rally, but sharp drop in bearishness.
2017.04 #2 Overall long term view of ETFs contradict consensus growth/inflation views.
2017.04 #3 BUY for Indicator Scoreboard and high TRIN point to final rally. Inverse HUI and TNX moves continue.
2017.04 #4 Using VIX P/C and TRIN composite shows high risk of >= 3% decline in SPX.
2017.04 #5 Nearing a SELL on SPX, possible SPX 2400+ at FOMC for top.
2017.05 #1 Possible top after French election, but lower SKEW indicates slow drop.
2017.05 #2 Very low VXX $ volume warns of probable drop SPX 2320-50 w/retest ATH by EOM June.
2017.05 #3 Mid-week drop to SPX 2350 gives ST Buy, expect 2400+. Intro to Options open interest.
2017.05 #4 SPX may remain over 2400 for a while, 7-8% pullback likely Jul-Sep. GDX options indicate 22-4 range.
2017.06 #1 SPX no signs of Sell, bonds near Sell, HUI neutral. Options show SPY 243-4 possible.
2017.06 #2 SPX overall indicator at Sell, but not smart beta p/c. Possible July top. Sell on TNX at 2.2%. Options GDX 22-4.
2017.06 #3 SPX bearish sentiment rising to neutral w/tech volatility. Options for July show resist at SPY 247. Similarities to 2014 for SPX.
2017.06 #4 SPX sentiment below neutral but NDX at Buy. Options - July 21 best prob of move to SPY 247, Sept 15 poss drop to 235. 3 volume indicators - high risk, capitulation, buy/hold/crash.
2017.07 #1 Rise in bearish sentiment may support SPX 50-75 pt rally from 2405, NDX sentiment extreme. Options using VIX monthly shows poss sharp vol rise into Sept 15.
2017.07 #2 SPX flat for week but volatility increased sentiment over neutral. Option open int show modest SPX strength to mid-Aug, QQQ strong support.
2017.07 #3 Strong rally lowers SPX sentiment, NDX sentiment points to new highs.
2017.07 #4 Overall sentiment pts to nearing top. NDX possible to 6000. VIX call indicator. Options int - down mid-Aug-Sep, up to mid-Oct.
2017.08 #1 Nearing major top. TA pts to SPX 2485-95 int top (act 2491), int target 2400, st SPY < 246.
2017.08 #2 Rapidily rising bearish sentiment likely to prevent drop to 2400. Rally to SPX 2480 possible. SPY target 246/7. VIX call indicator BUY.
2017.08 #3 Looking for SPX low 2405-15 (act 2417), possible rally into Labor Day to test ATH. HUI sentiment improving.
2017.08 #4 Bearish sentiment now at very high levels for SPX, HUI sentiment more positive.
2017.09 #1 Bounce as predicted, very high ST Indicator likely to result in 2-3 mn range 2450-2500.
2017.09 #2 Overall sentiment neutral, but high STI means more gains likely.
2017.09 #3 LT indicators show major top ahead, STI pts to SPX 2540-50 mid-Oct, Qtrly OI shows pullpack Nov-Dec low SPX 2400s.
2017.09 #4 Money flow (ETF) indicators pt to LT top ahead across asset classes. VIX call ind rising but no sell.
2017.09 #5 No change for most sentiment, but felling déjà vu to late 2015. VIX calls give SELL, may tie to NK holidays Oct 10/18.
2017.10 #1 VIX call indicator showing a sell, but ST Indiator only at neutral.
2017.10 #2 ST Indicator nowhere near a sell. Comparison to 2015 may indicate top early Nov near SPX 2600.
2017.10 #3 Upside targets reached, but persistent bearishness supports higher prices.
2017.10 #4 Possible small pullback then rally to SPX 2600, larger pullback by options exp.
2017.11 #1 Some sentiment measures show top may be near, but high VXX $ volume show top may be farther away than expected.
2017.11 #2 Expecting choppy week then move to SPX 2600+ early Dec, low SKEW means low risk of large decline. Bonds show rising bearishness that may be smart money.
2017.11 #3 Prior weeks choppiness has pushed up bearishness to level consistent with SPX 2600+ by early Dec.
2017.11 #4 More upside is likely before a pullback into mid-Dec.
2017.12 #1 Recent spike in VXX $ vol shows bears too eager, with very low revised CPC pt to a few more weeks of rally to SPX 2700+ into Jan, then 5-7% correction.
2017.12 #2 ST Indicator still positive with strong NDX upside sentiment, bonds pointing to upside breakout w/TNX 2.7-8% problem for stocks.
2017.12 #3 Consensus of SPX 3000 by EOY pts to meltup/meltdown or failure. Bond sentiment pts to higher rates.
2017.12 #4 No Santa rally points to Jan upside surprise. Early Jan over SPX 2700 w/ possible pullback to mid month.
2017.12 #5 Overall Indicator signals INT top near, ST Indicator says not yet. Mixed signals with weak close.
Saturday, April 29, 2017
Nearing a Sell Signal
Last week, I pointed out that a combination of a BUY on the Indicator Scoreboard and high SKEW were likely to provide a large move up and it was followed by a 50 pt jump in the SPX, exceeding my expectation. This week the SKEW remains high as the indicators are close to a SELL, so a top similar to June 2015 is likely by the Wed FOMC result.
The Indicator Scoreboard last week dropped to the -6.0 level, but a move to -8.0 matching the June and Dec 2015 levels is expected to signal a top. It remains to be seen whether the next drop will produce a new BUY and possible higher high or low bearishness as has been seen in the gold stock sector and a weaker rally.
The Short Term Indicator (VXX $ volume and Smart Beta P/C) has moved down strongly and is likely to reach a SELL on a rally back to the SPX ATH.
Since the RUT last week broke out of a potential H&S pattern, I wanted to compare the sentiment for that index to the SPX using the 3x ETFs. Higher levels of bearishness for the TZA/TNA compared to the SPXU/UPRO does support out performance for the RUT compared to the SPX.
Moving on to bonds (TNX), the rise in bearishness with rates last week does support a leveling out or even a move lower in rates.
Gold stocks (HUI) got the negative surprise I mentioned last week and still seems to be moving inversely to the TNX. It's possible that a stabilization in rates may be setting up TA triangle formation for a bigger move up or down. Sentiment points to the downside.
Conclusion. Last week's volatility was to the upside but that may be ready to reverse. Given the similarity in sentiment to the May-July 2015 period and the High Risk Composite SELL mentioned last week a top near SPX 2400 should produce a 3-4% short term correction over the next couple of weeks.
Weekly Trade Alert. I am expecting an intra day move over SPX 2400 that should be shorted, so SHORT at SPX 2400 or better, STOP at 2415, with a target of 2300-20. Updates @mrktsignals.
The Indicator Scoreboard last week dropped to the -6.0 level, but a move to -8.0 matching the June and Dec 2015 levels is expected to signal a top. It remains to be seen whether the next drop will produce a new BUY and possible higher high or low bearishness as has been seen in the gold stock sector and a weaker rally.
The Short Term Indicator (VXX $ volume and Smart Beta P/C) has moved down strongly and is likely to reach a SELL on a rally back to the SPX ATH.
Since the RUT last week broke out of a potential H&S pattern, I wanted to compare the sentiment for that index to the SPX using the 3x ETFs. Higher levels of bearishness for the TZA/TNA compared to the SPXU/UPRO does support out performance for the RUT compared to the SPX.
Moving on to bonds (TNX), the rise in bearishness with rates last week does support a leveling out or even a move lower in rates.
Gold stocks (HUI) got the negative surprise I mentioned last week and still seems to be moving inversely to the TNX. It's possible that a stabilization in rates may be setting up TA triangle formation for a bigger move up or down. Sentiment points to the downside.
Conclusion. Last week's volatility was to the upside but that may be ready to reverse. Given the similarity in sentiment to the May-July 2015 period and the High Risk Composite SELL mentioned last week a top near SPX 2400 should produce a 3-4% short term correction over the next couple of weeks.
Weekly Trade Alert. I am expecting an intra day move over SPX 2400 that should be shorted, so SHORT at SPX 2400 or better, STOP at 2415, with a target of 2300-20. Updates @mrktsignals.
Saturday, April 22, 2017
More Volatility Ahead
Last weeks S/T BUY did not reach the strong level expected due to Monday's gap up and therefore produced a weaker rally than expected. With indicators still in the BUY zone, any weakness from the French election results will likely be bought, but a new indicator introduced this week indicates that rallies should be sold. This week's discussion will be broken into two parts with the second half covering the risk measures Skew, Trin, and Vix P/C and a new composite, the High Risk Composite.
Part I.
There is only a minor change in the overall Indicator Scoreboard as high intra day volatility kept the bears salivating and is why I expect any pullback to be bought. A gap down Monday to the SPX 2320-30 level is possible, but would present the same setup expected last week.
The Short Term Indicator (VXX $ volume and Smart Beta P/C) has pulled back closer to the mean, so it's unlikely that last weeks SPX 30 pt rally is duplicated. My new upside target is only about SPX 2370.
One of the largest changes in sentiment last week was in bonds (TNX). The last several weeks, I pointed out that rising bearish sentiment was likely to lead to lower rates, and last weeks drop to 2.2% sent the bears running for cover. Any further drop in rates is likely to setup a SELL, so stabilization or increase in rates is likely, and long term pressure is still up.
Gold stocks (HUI) seem to have stabilized in a trading range, but with bearish sentiment so low downside surprises are likely.
Part II. Risk Measures
Several weeks ago in March, here, I pointed that the high SKEW readings have generally led to large price moves, up or down, and combined with the overall Indicator Scoreboard indicated a down move was likely. We now have another spike in the SKEW, but the Indicator Scoreboard is now pointing upward. The overall pattern is similar to the Nov-Dec 2016 period.
Earlier in the year, I noted that low VIX P/Cs were common prior to sharp market declines as in June and Dec 2015, as well as Oct of 2016. But the low readings in Feb 2017 saw no declines, and I noticed that this may be due to the low TRIN. We again saw near record lows in the VIX P/C last week as Wed saw VIX calls equal to half of all CBOE daily call volume.
The past several weeks, I have been following the TRIN (net advances/net volume, rising as volume declines), noting that rising TRIN indicated rising risk with a spike higher two weeks ago duplicating the Dec 2015 levels.
Trying to combine the effects of the TRIN and VIX P/C, I added the inverse TRIN and the VIX P/C to create a High Risk Composite. It may sound a little weird, but since Jan 2015, I identified seven SELLs and the first six ALL produced declines of 3% or greater in the SPX in the following six to eight weeks, including the 10%+ declines of Aug 2015 and Jan 2016. Multiple signals over a short period were counted as one. The sixth signal was at the March top, and the seventh signal occurred last week. BUYs don't seem to be significant. There also seems to be an average lag of about two weeks before the bulk of the decline.
Conclusion. More volatility. One potential price pattern that seems to fit the current sentiment patterns is the May-July 2015 topping pattern. Here we saw a six week decline of 3% from the May top, followed by a three week rally (now, SPX 2370-80 by May 2017), then an even sharper decline of about 4% (now, debt ceiling panic), concluded by a final rally to test ATH (now, EW fifth wave).
Weekly Trade Alert. I would be inclined to go LONG a retest of the SPX 2320s, but prefer to play it safe to see if there is a rally into May 3 FOMC as many are starting to hope for slow down in rate hikes. This fits the High Risk Composite time frame for a SHORT if S/T Indicator drops to SELL. Updates @mrktsignals.
Part I.
There is only a minor change in the overall Indicator Scoreboard as high intra day volatility kept the bears salivating and is why I expect any pullback to be bought. A gap down Monday to the SPX 2320-30 level is possible, but would present the same setup expected last week.
The Short Term Indicator (VXX $ volume and Smart Beta P/C) has pulled back closer to the mean, so it's unlikely that last weeks SPX 30 pt rally is duplicated. My new upside target is only about SPX 2370.
One of the largest changes in sentiment last week was in bonds (TNX). The last several weeks, I pointed out that rising bearish sentiment was likely to lead to lower rates, and last weeks drop to 2.2% sent the bears running for cover. Any further drop in rates is likely to setup a SELL, so stabilization or increase in rates is likely, and long term pressure is still up.
Gold stocks (HUI) seem to have stabilized in a trading range, but with bearish sentiment so low downside surprises are likely.
Part II. Risk Measures
Several weeks ago in March, here, I pointed that the high SKEW readings have generally led to large price moves, up or down, and combined with the overall Indicator Scoreboard indicated a down move was likely. We now have another spike in the SKEW, but the Indicator Scoreboard is now pointing upward. The overall pattern is similar to the Nov-Dec 2016 period.
Earlier in the year, I noted that low VIX P/Cs were common prior to sharp market declines as in June and Dec 2015, as well as Oct of 2016. But the low readings in Feb 2017 saw no declines, and I noticed that this may be due to the low TRIN. We again saw near record lows in the VIX P/C last week as Wed saw VIX calls equal to half of all CBOE daily call volume.
The past several weeks, I have been following the TRIN (net advances/net volume, rising as volume declines), noting that rising TRIN indicated rising risk with a spike higher two weeks ago duplicating the Dec 2015 levels.
Trying to combine the effects of the TRIN and VIX P/C, I added the inverse TRIN and the VIX P/C to create a High Risk Composite. It may sound a little weird, but since Jan 2015, I identified seven SELLs and the first six ALL produced declines of 3% or greater in the SPX in the following six to eight weeks, including the 10%+ declines of Aug 2015 and Jan 2016. Multiple signals over a short period were counted as one. The sixth signal was at the March top, and the seventh signal occurred last week. BUYs don't seem to be significant. There also seems to be an average lag of about two weeks before the bulk of the decline.
Conclusion. More volatility. One potential price pattern that seems to fit the current sentiment patterns is the May-July 2015 topping pattern. Here we saw a six week decline of 3% from the May top, followed by a three week rally (now, SPX 2370-80 by May 2017), then an even sharper decline of about 4% (now, debt ceiling panic), concluded by a final rally to test ATH (now, EW fifth wave).
Weekly Trade Alert. I would be inclined to go LONG a retest of the SPX 2320s, but prefer to play it safe to see if there is a rally into May 3 FOMC as many are starting to hope for slow down in rate hikes. This fits the High Risk Composite time frame for a SHORT if S/T Indicator drops to SELL. Updates @mrktsignals.
Saturday, April 15, 2017
Expecting a Final Rally
Last week's market action was pretty much as expected as my overall outlook was a downward continuation for the SPX with a target in the 2300-30 area and the close was 2328 Thurs. Sentiment continues to mirror the behavior of the 2015 tops in July-Aug and Nov-Dec. Overall and Short term sentiment has now moved into the BUY area, indicating that a short term, but sharp, short covering rally is likely to shake out the bears before the real decline begins. The TRIN as an inverse indicator of advancing volume support has now spiked to the level of Dec 2015.
The overall Indicator Scoreboard has now reached a BUY level equal to the mid-Dec decline before the last short covering rally that dropped sentiment back to the -8.0 area.
The Short Term Indicator (VXX $ volume and Smart Beta P/C) has also reached the BUY level with the 2.5 EMA, but is likely to spike higher to reach the Dec 2015 level early next week. With earnings releases next week providing a possible excuse for a rally, a late Monday/early Tuesday plunge to the low SPX 2300s may be the setup for a "turnaround Tuesday" seen often in options expiration week. For both July and Dec 2015 the market then rallied until a SELL was reached before a larger decline.
For those questioning whether this may be the elusive "fifth wave" that EWers are looking for, the TRIN (net advances/net volume, rising as volume declines) has now spiked to a slightly higher level than seen in Dec 2015, indicating that the bull phase is likely over..
Bonds (TNX) continue to see rising bearish sentiment even as rates fall as predicted in last week's post and point to more of the same, although a pause is likely if the SPX rallies.
Gold stocks (HUI) continued their inverse relationship with interest rates, ie, falling rates lead to higher gold and gold stock prices, but falling bearish sentiment indicates a trading range is likely with a decline to recent lows when a SELL is reached.
Conclusion. A short covering rally is expected to start next week that may last to the EOM/early May. If the SPX follows the same scenario as July and Dec of 2015 a rally is likely to a slightly higher level than the last one at 2378, but lower than the previous highs at 2390 and 2400. May and June may see a decline to the SPX 2200 level.
Weekly Trade Alert. Mon-Tue should see a tradeable bottom. Looking for SPX 2310 as a LONG with a target of 2380+. Cover at 2295. Updates if necessary at @mrktsignals.
The overall Indicator Scoreboard has now reached a BUY level equal to the mid-Dec decline before the last short covering rally that dropped sentiment back to the -8.0 area.
The Short Term Indicator (VXX $ volume and Smart Beta P/C) has also reached the BUY level with the 2.5 EMA, but is likely to spike higher to reach the Dec 2015 level early next week. With earnings releases next week providing a possible excuse for a rally, a late Monday/early Tuesday plunge to the low SPX 2300s may be the setup for a "turnaround Tuesday" seen often in options expiration week. For both July and Dec 2015 the market then rallied until a SELL was reached before a larger decline.
For those questioning whether this may be the elusive "fifth wave" that EWers are looking for, the TRIN (net advances/net volume, rising as volume declines) has now spiked to a slightly higher level than seen in Dec 2015, indicating that the bull phase is likely over..
Bonds (TNX) continue to see rising bearish sentiment even as rates fall as predicted in last week's post and point to more of the same, although a pause is likely if the SPX rallies.
Gold stocks (HUI) continued their inverse relationship with interest rates, ie, falling rates lead to higher gold and gold stock prices, but falling bearish sentiment indicates a trading range is likely with a decline to recent lows when a SELL is reached.
Conclusion. A short covering rally is expected to start next week that may last to the EOM/early May. If the SPX follows the same scenario as July and Dec of 2015 a rally is likely to a slightly higher level than the last one at 2378, but lower than the previous highs at 2390 and 2400. May and June may see a decline to the SPX 2200 level.
Weekly Trade Alert. Mon-Tue should see a tradeable bottom. Looking for SPX 2310 as a LONG with a target of 2380+. Cover at 2295. Updates if necessary at @mrktsignals.
Sunday, April 9, 2017
ETFs Pointing to a Changing Tide
There is not much change in the short term sentiment view this week, so I want to take a broader view of several of the ETF sentiment charts since the same theme seems to be prevalent in each.
First to cover normal stock sentiment I will use the intermediate Indicator Scoreboard (overall composite), Short Term Indicator (VXX $ volume and Smart Beta P/C), and TRIN.
The Indicator Scoreboard shows continued rising bearish sentiment after reaching an official SELL, similar to the June and November readings in 2015 as antsy bears load up on puts while trying to pick market tops. Previously this has resulted in a sharp short covering rally after a BUY is generated causing sentiment to fall back to the -8.0 level before a serious decline.
The Short Term Indicator remains near neutral with no clear direction indicated.
The TRIN continues to inch upward showing declining volume support as measured by net advances/net advancing volume similar to the June and December 2015 periods.
The ETF section covers the SPX, NDX, BKX, TNX and HUI. First the SPX with SPXU/UPRO is clearly the lowest bearish sentiment of the last several years.
The NDX with SQQQ?TQQQ is similar and even more extreme than the SPX. The correlation that comes to mind is 1999-2000 with the tech blow off prior to the Bush II Presidency.
The BKX with FAZ/FAS is a new measure for the banking sector which at least price wise is showing the H&S pattern as the RUT measure show last week. The main difference is that the BKX is much more influential for the DJIA and SPX.
Next, the bond sentiment using TNX with TBT/TLT is showing rising bearish sentiment even as interest rates fall. Overall, the contrary position is that the inflation/growth expectations seen in the stock and gold markets may be unwarranted with a two year inverse H&S pointing to a possible drop to 2.0% or lower.
Finally, for gold stocks (HUI) with DUST/NUGT bearish sentiment remains weak.
Conclusion, Whether true or not, sentiment all seems to point to strong expectations of inflation and higher growth. The most unexpected outcome may be the stagflation equivalent of the 1970s with low growth and rising interest rates as the FED tries to "normalize" policy.
Weekly Trade Alert. None. A drop to the SPX 2300-30 area seems to be the most likely to set up a short covering BUY that would be consistent with prior tops. Updates if necessary at @mrktsignals.
First to cover normal stock sentiment I will use the intermediate Indicator Scoreboard (overall composite), Short Term Indicator (VXX $ volume and Smart Beta P/C), and TRIN.
The Indicator Scoreboard shows continued rising bearish sentiment after reaching an official SELL, similar to the June and November readings in 2015 as antsy bears load up on puts while trying to pick market tops. Previously this has resulted in a sharp short covering rally after a BUY is generated causing sentiment to fall back to the -8.0 level before a serious decline.
The Short Term Indicator remains near neutral with no clear direction indicated.
The TRIN continues to inch upward showing declining volume support as measured by net advances/net advancing volume similar to the June and December 2015 periods.
The ETF section covers the SPX, NDX, BKX, TNX and HUI. First the SPX with SPXU/UPRO is clearly the lowest bearish sentiment of the last several years.
The NDX with SQQQ?TQQQ is similar and even more extreme than the SPX. The correlation that comes to mind is 1999-2000 with the tech blow off prior to the Bush II Presidency.
The BKX with FAZ/FAS is a new measure for the banking sector which at least price wise is showing the H&S pattern as the RUT measure show last week. The main difference is that the BKX is much more influential for the DJIA and SPX.
Next, the bond sentiment using TNX with TBT/TLT is showing rising bearish sentiment even as interest rates fall. Overall, the contrary position is that the inflation/growth expectations seen in the stock and gold markets may be unwarranted with a two year inverse H&S pointing to a possible drop to 2.0% or lower.
Finally, for gold stocks (HUI) with DUST/NUGT bearish sentiment remains weak.
Conclusion, Whether true or not, sentiment all seems to point to strong expectations of inflation and higher growth. The most unexpected outcome may be the stagflation equivalent of the 1970s with low growth and rising interest rates as the FED tries to "normalize" policy.
Weekly Trade Alert. None. A drop to the SPX 2300-30 area seems to be the most likely to set up a short covering BUY that would be consistent with prior tops. Updates if necessary at @mrktsignals.
Sunday, April 2, 2017
Uncertain Short Term, Bearish Long Term
Last week, I showed two topping patterns from 2015, here, June-July and Nov-Dec, but I forgot to discuss the later which appears to be what happened. June-July saw an extended bottom with lower retest setting up sentiment for a larger rally, while Nov-Dec saw a spike low followed by a sharp, but weaker rally, that lead to a higher retest. Sentiment last week seemed to support the second scenario with rapidly falling bearishness until Friday. EOQ window dressing obviously was a big factor for the rally and Friday everyone assumed that a failure would follow as P/C ratios soared, intraday here, driving up the VIX. VXX volume was weak throughout the day but increased by 50% the last hour and after hours.
The net result was an increase in bearishness using the Short Term Indicator (VXX $ volume and Smart Beta P/C) that delayed the SELL that seemed likely earlier in the week. So its hard to tell if we follow the Nov-Dec period with a higher retest to SPX 2330+ then rally, or maintain some upward momentum until a SELL is generated.
Longer term sentiment patterns going back to 2013 for the SPX using the SSO/SDS ETFs, however, still lead me to believe that a topping pattern of some magnitude is forming.
Intermediate Term Indicators
The overall Indicator Scoreboard for the SPX has continued to stair step upwards in a pattern similar to the 2015 tops as well as mid 2016, but the recent pullback has moved sentiment back to neutral.
One index that may be giving an indication of the future is the RUT, now up more than 50% from its early 2016 lows, where a large head and shoulders pattern may be forming.
Bearish bond sentiment (TNX) continues to inch upwards with the expectation of higher growth and inflation, but the contrarian position is that the Republican low tax/high growth agenda may face continued problems.
Finally, bearish sentiment for gold stocks (HUI) is little changed with the HUI hovering around the 200 level.
Conclusion. The price targets given last week of SPX 2325 to the downside and 2380 worked out well, but my ignoring the EOQ effect and the Nov-Dec 2015 possibility kept me out of the market. The recent uptick in bearishness Friday supports a trading range for the next few weeks. Potential problems for the tax cut bill will probably be shown by the debt ceiling debate as tax cuts and increased infrastructure spending can only occur with large increases in government debt.
Weekly Trade Alert. None expected. Updates as required at @mrktsignals.
The net result was an increase in bearishness using the Short Term Indicator (VXX $ volume and Smart Beta P/C) that delayed the SELL that seemed likely earlier in the week. So its hard to tell if we follow the Nov-Dec period with a higher retest to SPX 2330+ then rally, or maintain some upward momentum until a SELL is generated.
Longer term sentiment patterns going back to 2013 for the SPX using the SSO/SDS ETFs, however, still lead me to believe that a topping pattern of some magnitude is forming.
Intermediate Term Indicators
The overall Indicator Scoreboard for the SPX has continued to stair step upwards in a pattern similar to the 2015 tops as well as mid 2016, but the recent pullback has moved sentiment back to neutral.
One index that may be giving an indication of the future is the RUT, now up more than 50% from its early 2016 lows, where a large head and shoulders pattern may be forming.
Bearish bond sentiment (TNX) continues to inch upwards with the expectation of higher growth and inflation, but the contrarian position is that the Republican low tax/high growth agenda may face continued problems.
Finally, bearish sentiment for gold stocks (HUI) is little changed with the HUI hovering around the 200 level.
Conclusion. The price targets given last week of SPX 2325 to the downside and 2380 worked out well, but my ignoring the EOQ effect and the Nov-Dec 2015 possibility kept me out of the market. The recent uptick in bearishness Friday supports a trading range for the next few weeks. Potential problems for the tax cut bill will probably be shown by the debt ceiling debate as tax cuts and increased infrastructure spending can only occur with large increases in government debt.
Weekly Trade Alert. None expected. Updates as required at @mrktsignals.
Subscribe to:
Posts (Atom)